I/O Analyzer

In this document we will review a utility from VMware Labs that will help us test our storage system, under a virtual appliance called VMware IO Analyzer. This simple appliance will show us performance graphs at the VM and host level, will use Iometer for this purpose & This is top,

We will download the appliance from the VMware Labs, it will come in OVF format and we will import it with the VMware client into our virtual infrastructure.

Once the appliance is deployed, Before you turn it on, We can create an additional hard drive that will be where we do the tests, we will indicate that the disc is pre-filled with 'Thick Provision Eager Zeroed’ and we will place it in the datastore where we want to do the tests. We will also delete the 100Mb that comes with it,

Turn on the virtual appliance, Enter your console and select the option “Configure Network” to configure network settings,

We will configure a static or dynamic IP address.

Once we are already logged in, we can connect with a browser from another computer.

We will need to add the hosts on which we have the IO Analyzer appliances to perform the benchmark on our SAN, all this from “IOMETER TESTS”

Later we will select each host, each IO Analyzer vapp, a workload to test and the IP address of the vapp. We will introduce several VM's against different/same datastores to check the behavior of the(s) cabin(s). We will indicate a minimum of 120 seconds, recommended between 5 and 10 minutes.
We will be able to save these settings to load them later, Multiple example templates come, In this case I will use the one from 'Exchange_2007.icf', in addition to the following:
– Exchange 2003 – 4k block 80% Random – 60% Read
– Exchange 2007 – 8k block 80% Random – 55% Read
– SQL Server – 16k block 100% Random -66% Read
– Oracle OLTP – 8k block 88% Random – 72% Read
– Oracle DW – 32k block 20% Random – 90% Read
– Max IOPS 4k block 0% Random – 100% Read
– Max TP – 32k block 0 % Random – 100% Read
* If we don't get results and we have an error 'InvalidEsxtopCsvFile’ It could be that we do not have a connection to the hosts or that we have some special character in the root password (would be solved by introducing the ” Before the symbol).

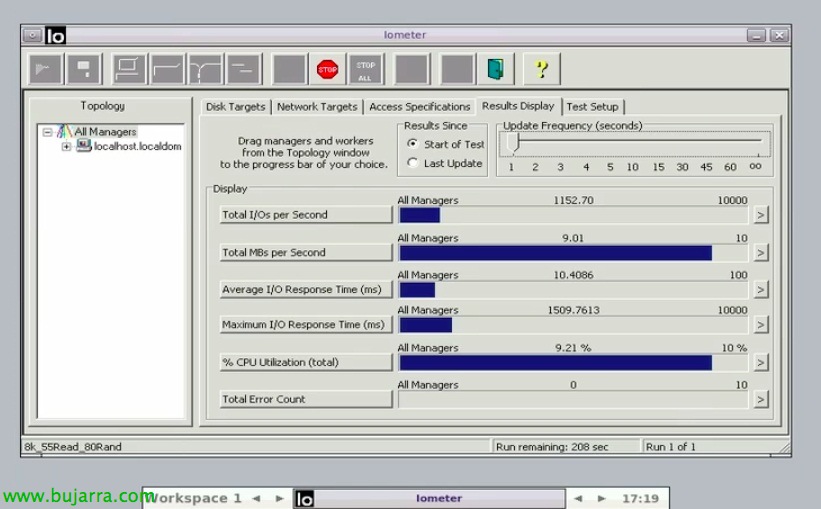
During the stress process we will see how the IO Analyzer VM will load the Iometer in an automated way, we can go to the “Results Display” to see the process before waiting for the reports 🙂

Once the time has elapsed, We'll go to the “RESULTS” & We will choose the report. This image is from a 'laboratory' environment’ very poor, in which we have only scanned a disk from a vapp in a datastore.
We will observe statistics at the guest level (Ioter appliance vistal) and at the host level (This is top). At the guest level:
– IOPS: Number of I/O operations per second.
– ReadIOPS: Number of read operations per second.
– WriteIOPS: Number of write operations per second.
– MBPS: Total throughput per second.
– ReadMBPS: Read throughput per second.
– WriteMBPS: Write throughput per second.
At the host level:
– CMD's: Number of I/O operations per second.
– READS: Number of read operations per second.
– WRITES/s: Number of write operations per second.
– MBREADS/s: Read throughput per second.
– MBWRITES/s: Write throughput per second.
– DAVG/cmd (Msec): Latency between HBAs and discs.
– KAVG/cmd (Msec): Latency created by the vmkernel (should be close to 0.00 ms).
– GAVG/cmd (sec): Total latency as seen by the guest (DAVG + KAVG)
– QAVG/cmd (sec): Average queue latency.
Data for reference:
– Discs 7200 Rpm (SATA) between 75 – 100 IOPS.
– 10K rpm discs (SATA) between 125 – 150 IOPS.
– 10K rpm discs (SAS) envelope 140 IOPS.
– 15K rpm discs (SAS) between 175 – 210 IOPS.
– SSD disks from 6000 IOPS!!!

This other image, with slightly higher performance as it is a 'production' environment, we will see the combined scanning of two machines on two different datastores located in two different booths, it would serve as a clear comparison.

If we want, we will be able to record the behavior of one of our machines with a manual process in which we will export our current load and then import it into IO Analyzer. To do this, we will rely on the command 'vscsiStats’ to get the VM stats, if we run 'vscsiStats -l’ will list all the VMs of this host with their worldGroupID (GID) and their virtual disks (handleID). Con 'vscsiStats -s -t -w GID -i handleID’ we will begin to collect the information of the load in that vHD to later play it. We will save the trace in a file with 'logchannellogger vscsiStats-traceChannel /tmp/stats.log’

We will stop the process with 'CTR + X’ when we have enough information, we will also stop the collection process with 'vscsiStats -x -w GID -i handleID'.
Con 'vscsiStats -e /tmp/stats.log > /TMP/stats.csv’ we will convert the results into a CSV file.

The first thing will be to upload the traces from “TRACE UPLOAD”, Give you a name & description, we will give you the full path of the file in CSV format as well as the name of the host that has it & The root password. “Upload”,

We will select a host as before, the IOAnalyzer vapp and the newly generated trace, We will indicate the disk where you will perform the analysis, speed of execution (0.5x, 1.0x, 2.0x…) & We give “Run”,

And that's it, we will see the result of some analyses previously executed in another VM that we have moved to this one to test a new storage, etc…