VMware vCenter Log Insight

We already know that the collection of logs in our systems is essential to know the health of the state or to know possible problems, vCenter Log Insight is a log manager that allows us to automate the collection of logs and analyze the information from our vSphere system in a very simple way.
vCenter Log Insight collects logs from the vCenter and ESXi hosts, working as a Syslog, stores logs and events in DB to be able to process them later and generate personalized Dashboards with the information we need in one click. Anyone who already knows how to work with Splunk, You will see how familiar this product is to you! Licensed per virtual machine.
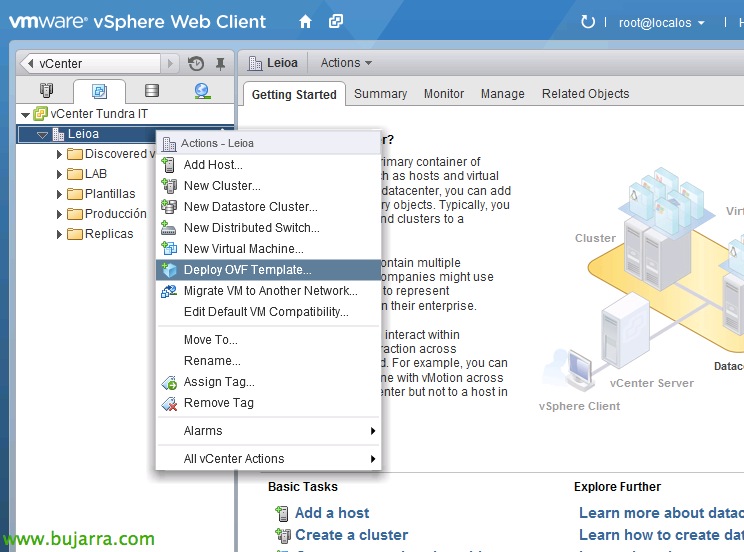
We must download the appliance from the Official Website and import it into our virtual platform,

In the appliance deployment wizard, we will need to configure the network, either fixed or with DHCP, that we must have previously defined in our DataCenter,
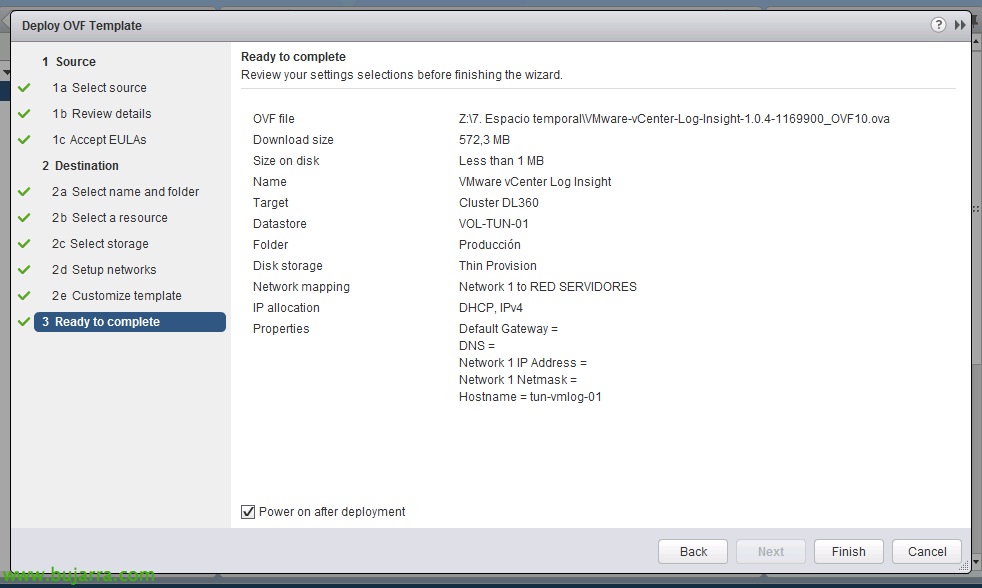
We would finish the import & we turn on the VM!
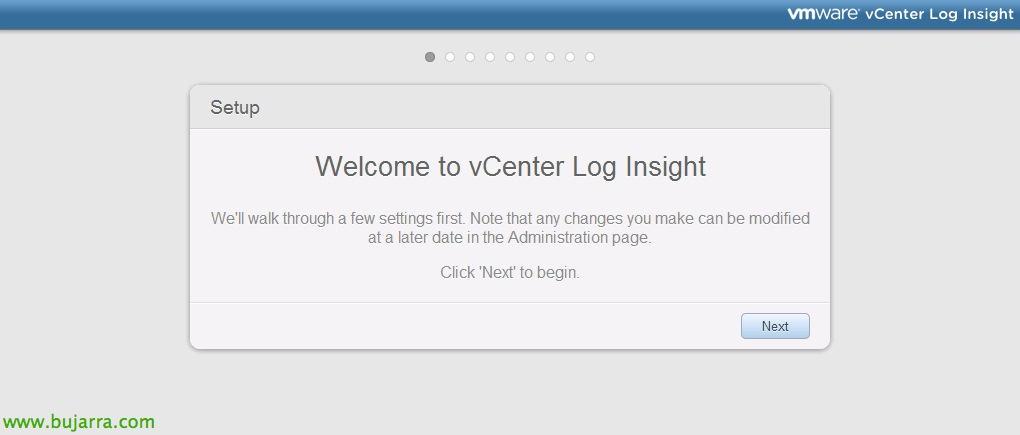
We connect via web to the appliance's IP, We will have a brief configuration wizard, “Next”,
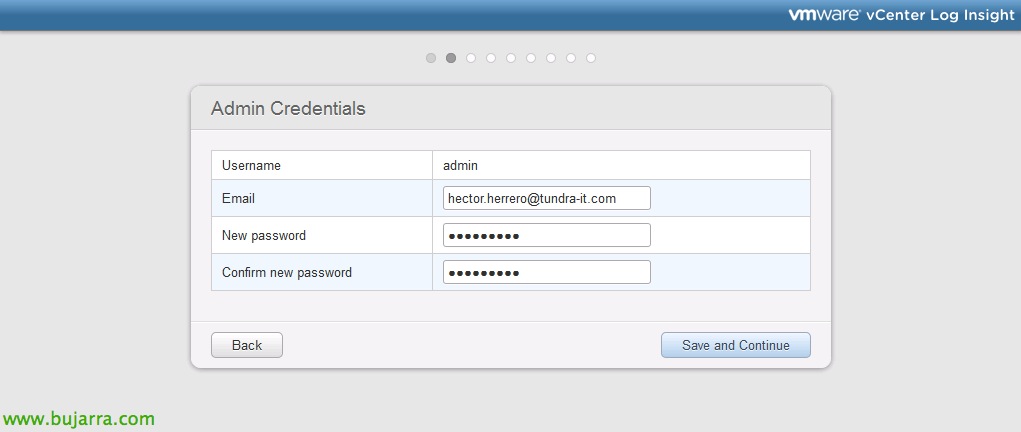
First, We set the password to the admin user, “Save and Continue”,
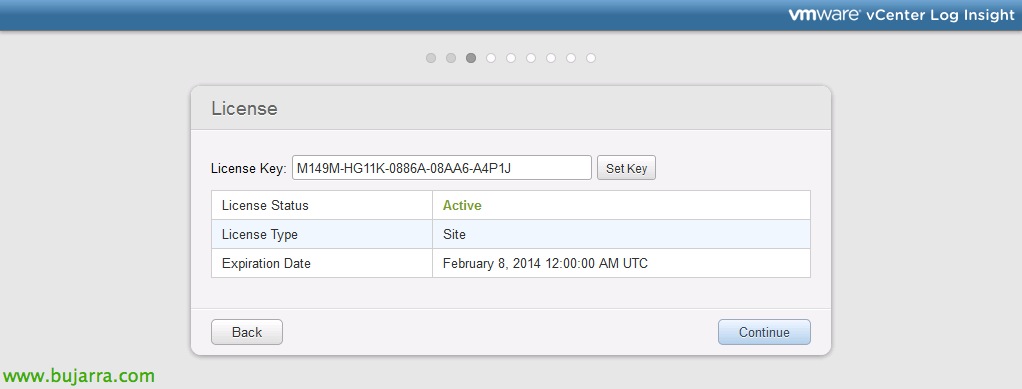
Introducing the License Code, in this case it will be Demo mode, “Continue”
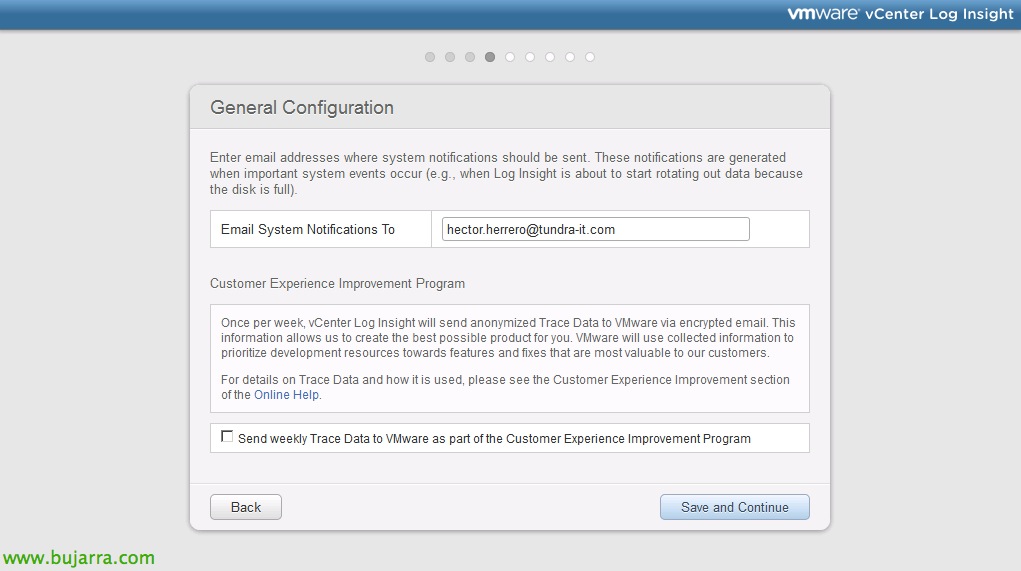
We provide the email address for notifications, “Save and Continue”
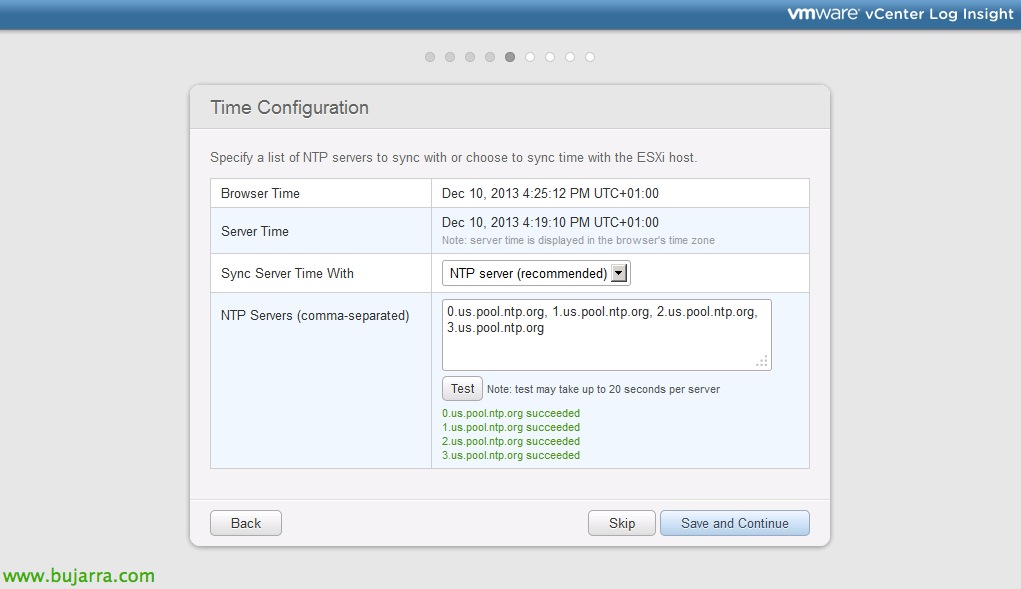
It would be recommended to configure the time service using NTP servers, We introduce them & “Test”,

The same, we will need to configure the SMTP service to send emails, we enter the corresponding parameters and test it.

We must specify the vCenter server and we can also integrate it with vCenter Operations Manager if we also have it deployed in our network!

If we are interested in not deleting logs and archiving them, we must enable “Enable Data Archiving”,
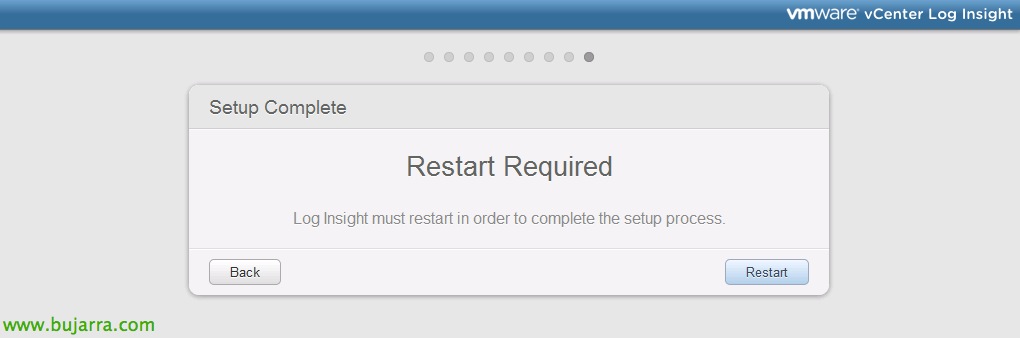
GOOD, We finish with the wizard, We must restart the appliance in order to start working with it!
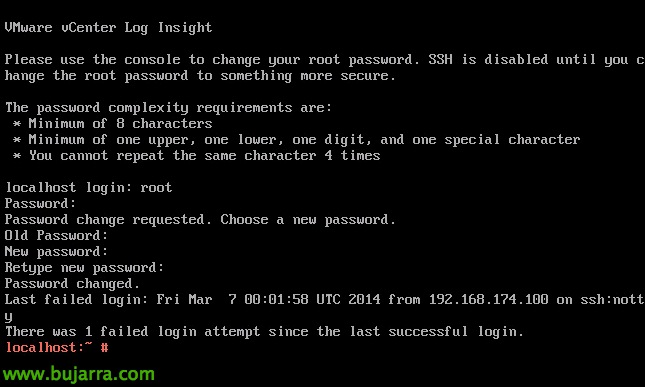
Enter the virtual machine console to change the root password, We enter without a password, leaving it blank and it will ask us to enter a new one.
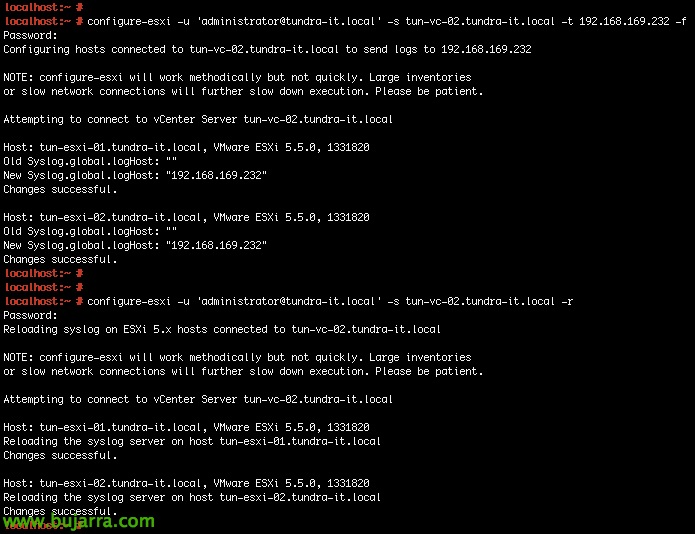
After, it will be important to add the ESXi hosts of our infrastructure so that they redirect the logs to our new syslog., what the vCenter Log Insight will be. We will do it with: 'configure-esxi -u ADMIN_DE_vCENTER -s SERVIDOR_VCENTER -t IP_LOG_INSIGHT -f', and once executed, We will reload the configuration on the hosts so that it applies immediately with 'configure-esxi -u ADMIN_DE_vCENTER -s SERVIDOR_VCENTER -r’

And well, this will be the main dashboard of vCenter Log Insight, where we will have on the one hand the Dashboards that are already customized consoles with interesting views and on the other 'Interactive Analytics’ with which we can analyze and process the logs in search of some data or query.
In this document, We'll do a very basic example where we'll get the latency time out of our hosts, If we search for 'SCSI Performance for example’ We will filter logs with this type of information, we'll look at the average and latency times of IO, we can select the microseconds and extract that field to be able to work on it later; select click on 'Extract field',
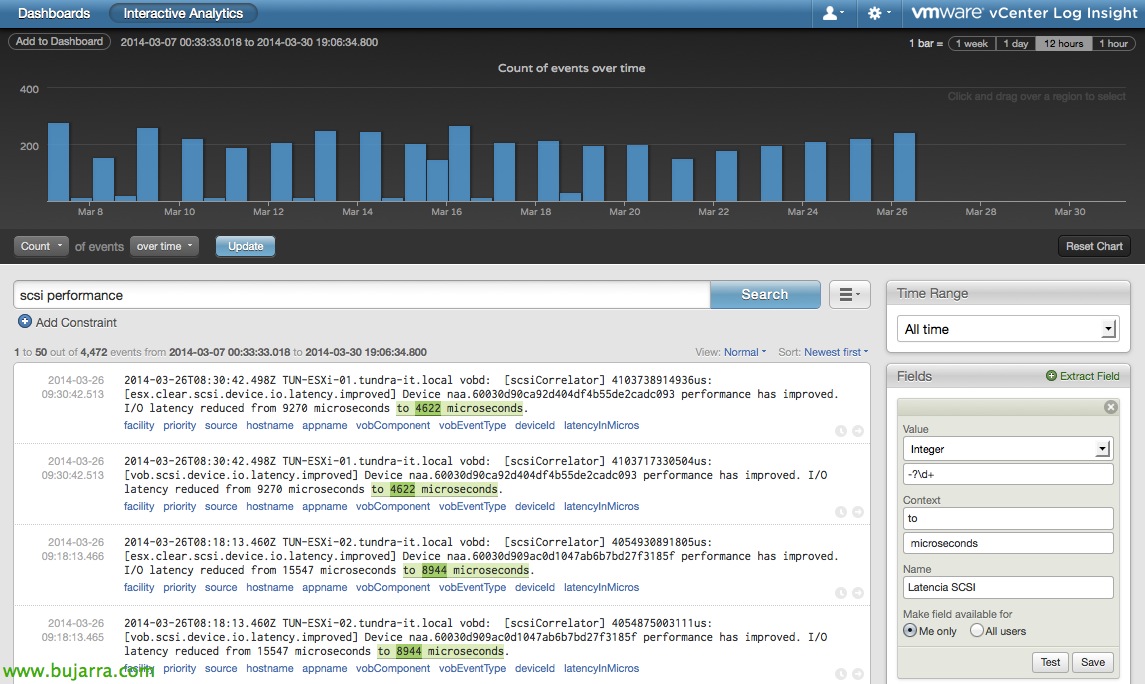
We set a name for it, in this case 'SCSI latency'’ & “Save”,

It will also be interesting to know the device and then analyze the latency separately, we also added this field and called it 'SCSI Devices',

If in the panel we select 'Average’ of 'SCSI latency’ over time & click on 'Update', and in 'Time Range'’ We select an appropriate log analysis time, We will get a graph with the average latency in that period!
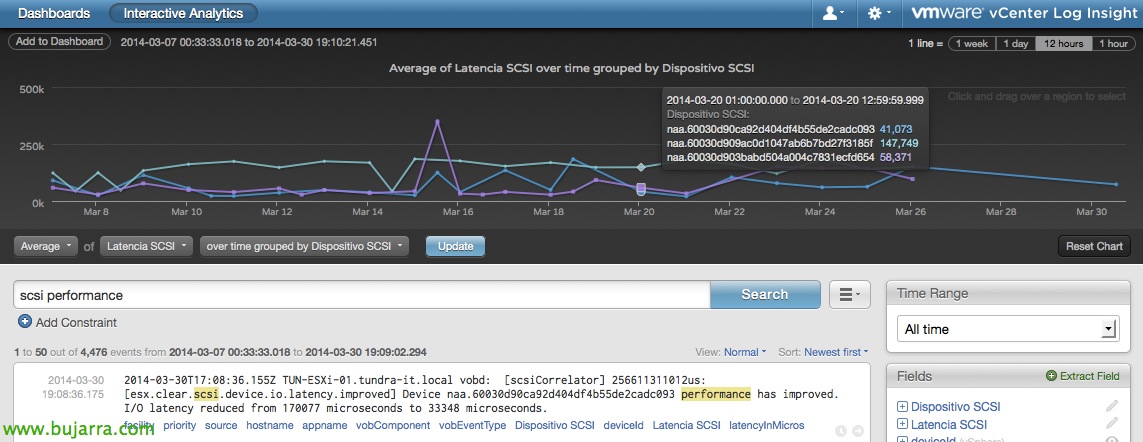
We will also be able to, Separate latency by device to analyze which Datastore is suffering the most, if we also add 'grouped by SCSI device' to the panel’ it will separate it and we will see the microseconds that each IO takes on average in that period of time, as seen in the somewhat tall example.
The good thing about this is that we will be able to take the graphs to the Dashboard (since “Add to Dashboard”), to have a fully customized panel with the most interesting graphics of our system.
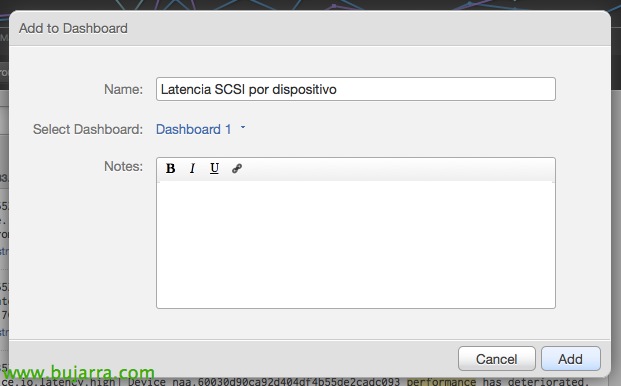
We introduce a name to the graph & “Add”,

We can also add filters if we are interested to have more accuracy in what we are looking for, for example, we filter you by latencies greater than 900000 Microseconds (Which is outrageous) And we could add this graph to the dashboard as well.
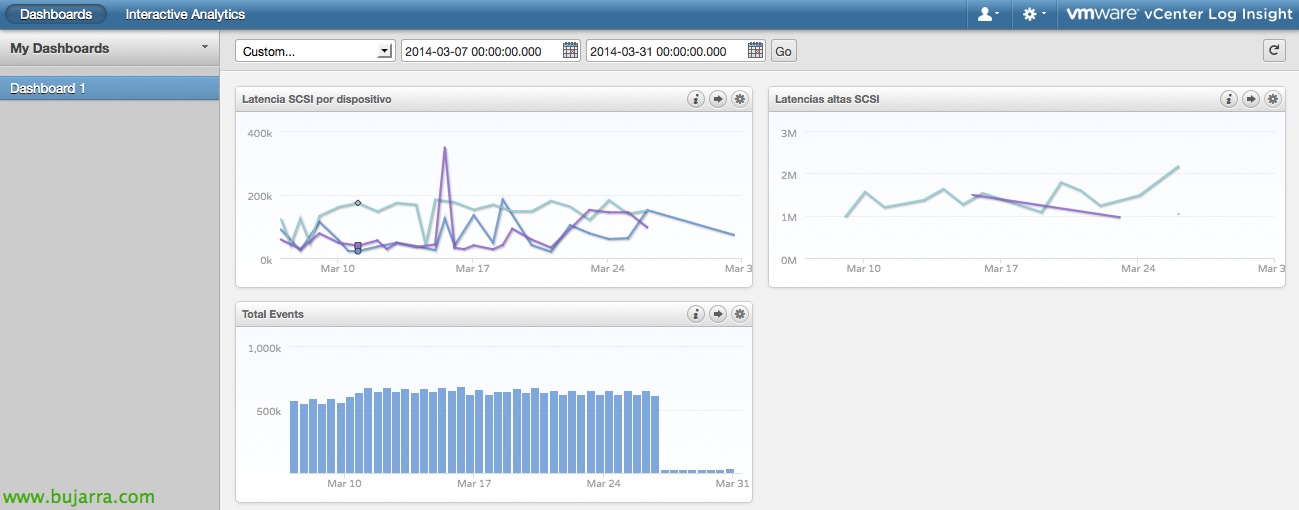
This would be one panel with the graphs created with a summary of the latencies and in the other only with the critical latencies. In addition, Content Packs can be added to monitor the logs of other manufacturers and not only VMware, but also from Cisco, NetApp, EMC, VCE… we can download them from your website.