Collecting Synology LOGs in Elasticsearch and Visualizing Them in Grafana

Well, Another post is about collecting logs and visualizing them to understand what is happening in our infrastructure, today we have a document where we will see how to send the Logs of a Synology to our Logstash and then store it in Elasticsearch and finally visualize it with Grafana.
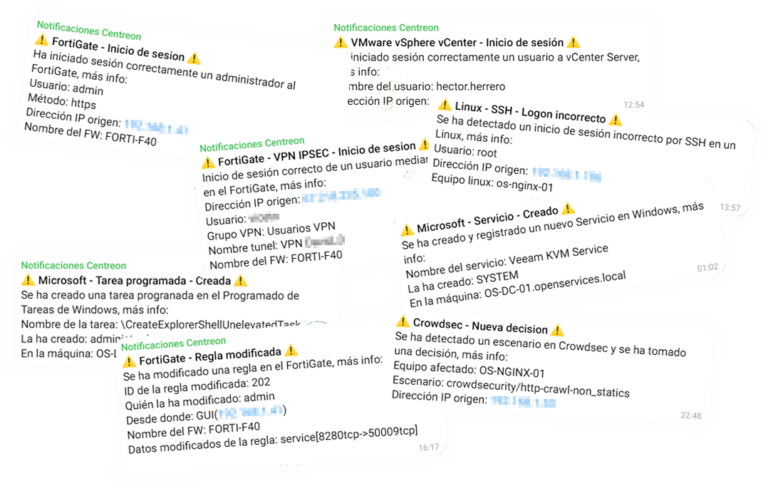
So, Cane to the monkey that is made of rubber! (I'm so old, Yogurt…) goes! If we have a NAS from the manufacturer Synology and we want to know what is happening in it, The best thing is to always throw ourselves into the logs, But it's kind of boring to read lines and lines of text, that do not always go in real time, that we find difficult to understand… Well, that's what (and other things) we have Elastic Stack, where Synology will send the Logs to Logstash, there we will receive them and treat them, separating the information we are interested in into different fields and then storing it in Elasticsearch. To visualize the data we can always use Kibana, but I'm more of a Grafana fan, I am sorry, So whatever choice it is, You will be able to visualize this collected data in different formats, in tables, Graphic, Cheeses, World Map… this is how you will interpret what happens in Synology, who accesses or tries to do so, and what it does… You'll be able to see it as usual, in real time or in historical mode to make queries. ¡Started!
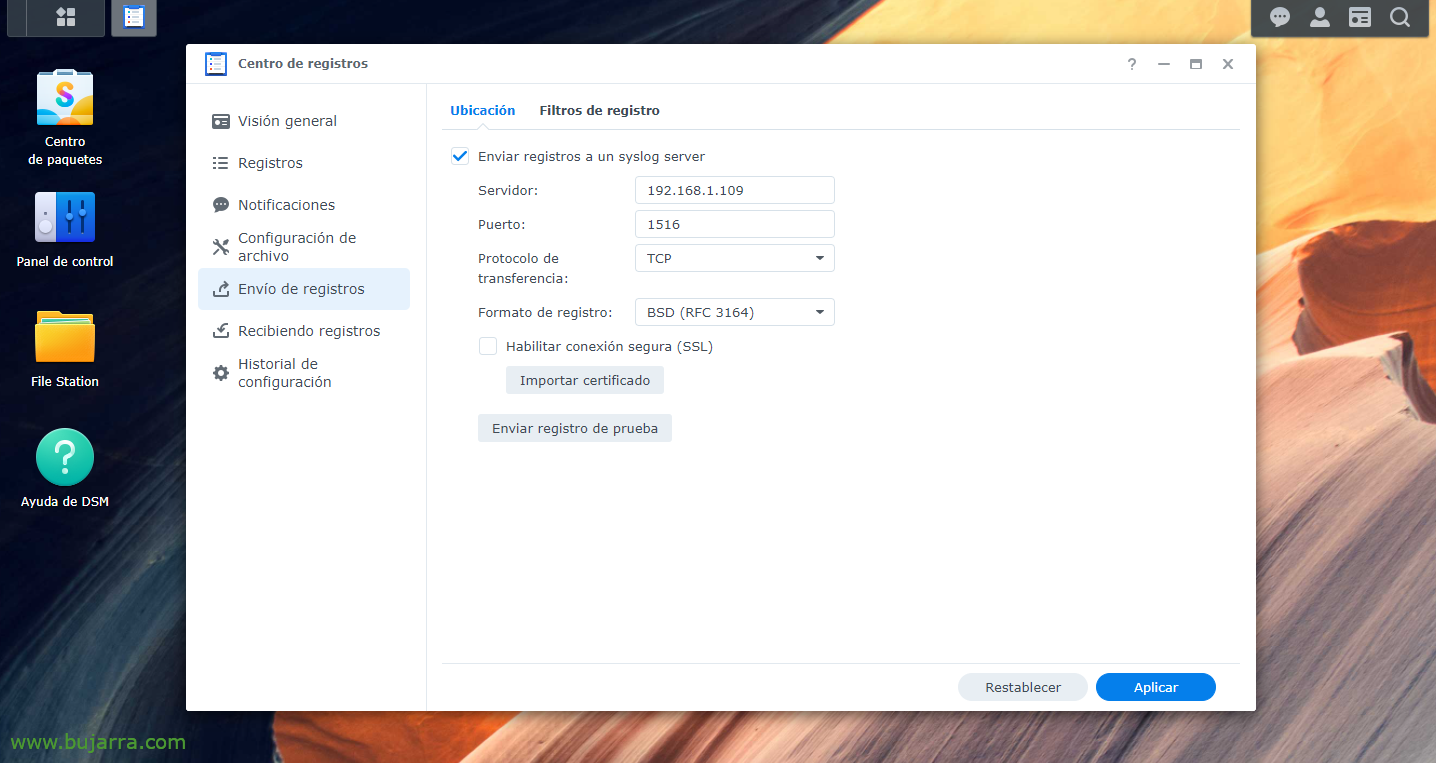
First we obviously have to have the Elastic Stack part installed, What has beenLogstash, Elasticsearch andKibana; then it would be to instruct our Synology to send the Logs to Logstash, to the port of our choice, We'll invent one, from the “Records Center" > “Sending Logs” > We enable “Send logs to a syslog server”, we specify the IP of Logstash and the port and TCP or UDP of our choice. And we apply the changes.
Input {
        TCP {
                type => "Synology"
                port => "1516"
                tags => ["Synology"]
        }
}

filter {

        if [type] == "Synology" {
                        Grok {
                            match => { "Message" => [
                              "^<%{POSINT:syslog_pri}>%{SYSLOGTIMESTAMP:syslog_timestamp} %{HOSTNAME:host_title} WinFileService Event: %{WORD:action}, Path: %{GREEDYDATA:path}, File/Folder: %{WORD:path_type}, Size: %{BASE10NUM:file_size} %{WORD:file_size_unit}, User: %{USERNAME:username}, IP: %{IP:src_ip}",
                              "^<%{POSINT:syslog_pri}>%{SYSLOGTIMESTAMP:syslog_timestamp} %{HOSTNAME:host_title} Connection: User \[%{USERNAME:username}\] from \[%{HOSTNAME:Team}\(%{IP:src_ip}\)\] Via \[%{DATE:Protocol}\] %{GREEDYDATA:Message} \[%{DATE:shared_folder}\]",
                              "^<%{POSINT:syslog_pri}>%{SYSLOGTIMESTAMP:syslog_timestamp} %{HOSTNAME:host_title} Connection: User \[(%{USERNAME:username})?\] from \[%{IP:src_ip}\] %{GREEDYDATA:Message}",
                              "^<%{POSINT:syslog_pri}>%{SYSLOGTIMESTAMP:syslog_timestamp} %{HOSTNAME:host_title} Connection\[%{INT:Id_proc}\]: SYSTEM: %{GREEDYDATA:Message}",
                              "^<%{POSINT:syslog_pri}>%{SYSLOGTIMESTAMP:syslog_timestamp} %{HOSTNAME:host_title} System %{USERNAME:username}: %{GREEDYDATA:Message}"
                                       ]
                            }
                        }
        }
}

output {

        if ([type]=="Synology"){

                ElasticSearch {
                   index => "synology-%{+YYYY. MM.dd}"
                   hosts=> "DIRECCION_IP_ELASTICSEARCH:9200"
                }

        }
}
Now we go to our Logstash, and there we can create filters to separate the different fields of the various logs we receive. As always, it can be improved, but these grok patterns will at least be useful for a Synology DSM with version 7.0. So we create a configuration file, for example ‘/etc/logstash/conf.d/synology.conf’ and with this content we will do something.

Once the configuration file has been created, remember to restart the Logstash service to reload. Afterwards as always, we will go to Kibana and once the data is coming in we can go to "Management" > "Stack management" > "Kibana" > "Index Patterns" > "Create index pattern" to create the index pattern, As I said, as usual (in this case and without the quotation marks) 'synology-*' and we will have the data already stored in Elasticsearch correctly. Now we could connect from “Analytics” > "Discover" to our Synology index and visualize that it is collecting data.

And then, after creating the index in Kibana, now in our Grafana we should create a "Data Source" that points against our Elasticsearch and the Synology index. Then it's letting your imagination run wild, make a Dashboard with different Dashboards, with different data to visualize, One of Style Sankey to view origin/destination IPs and traffic being sent, in column format, instalemate to view specific data for example the correct logins, Incorrect, The connections, the files that are created, Modify, Eliminate, the users who perform the action...