Collecting Ubiquiti UniFi LOGs in Elasticsearch and Visualizing Them in Grafana

And we continue with more strange things… today the first one of collecting Logs to the Ubiquiti Unifi environment, of our APs, Switches… for the second time we parse., we treat the Logs with Logstash and for dessert we store it in Elasticsearch, and the icing on the cake will be visualizing it with Grafana. All this to control in real time what happens in our communications infrastructure, who is trying to access the Wisfis…

Collecting VMware vCSA LOGs in Elasticsearch and Visualizing Them in Grafana

¡Come! Another one of logs please! This time we will see how to exploit the Logs of our beloved VMware vSphere environment, from the vCSA or vCenter Server Appliance we will redirect the logs to Logstash to be processed and stored in Elasticsearch, finally we will be able to visualize them in a more graphic way with Grafana. This way we will understand in real time what is happening or we will be able to have reports with the data of the last 24 hours, week, month… Fully customizable, free…

Logon auditing of Active Directory users with Elasticsearch and Grafana

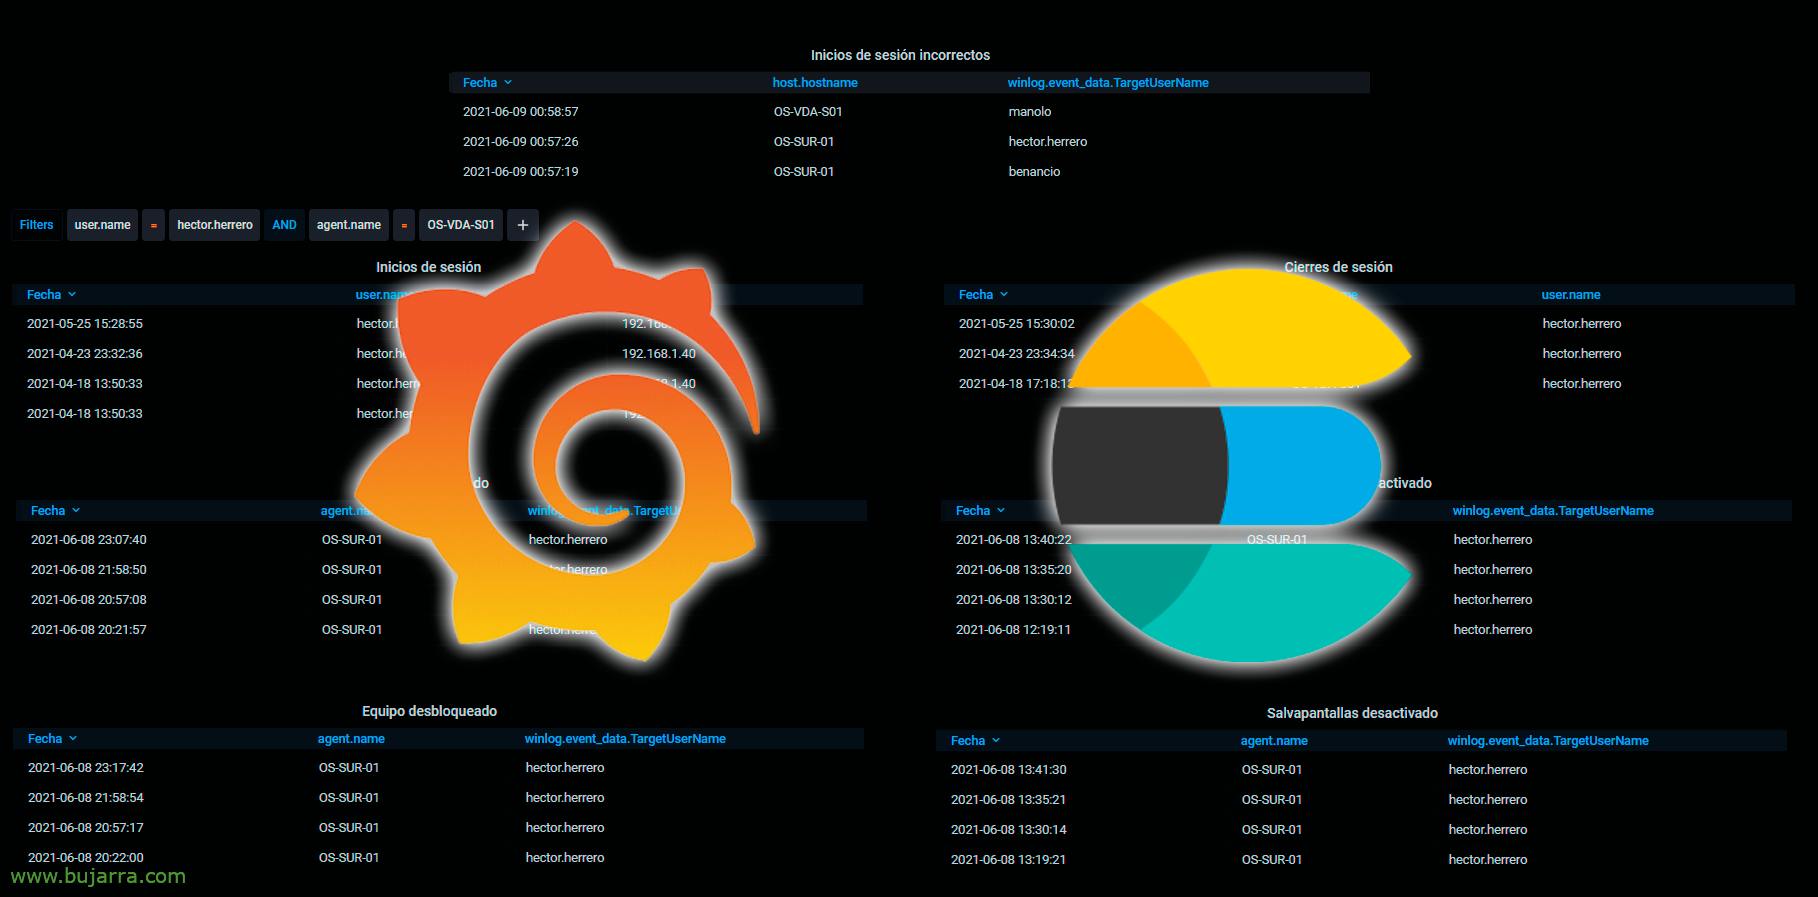
Something very common that we are usually asked for is the possibility of knowing the logons and other interesting information that a user can generate. In this post we will see how to visualize data as interesting as: When have they logged in, When they closed the session, Incorrect login attempts, When a computer has been locked, or unlocked, or when the screensaver has tripped, or it has been deactivated…