Collecting VMware ESXi LOGs in Elasticsearch and Visualizing Them in Grafana

Well, today it's time for another post about log collection, how to treat them and above all how to visualize them; in this document we will see how to perform the entire process with the VMware ESXi hypervisor logs, treat them with Elastic Stack and finally visualize in Grafana what interests us, such as error logs, Incorrect sign-ins…
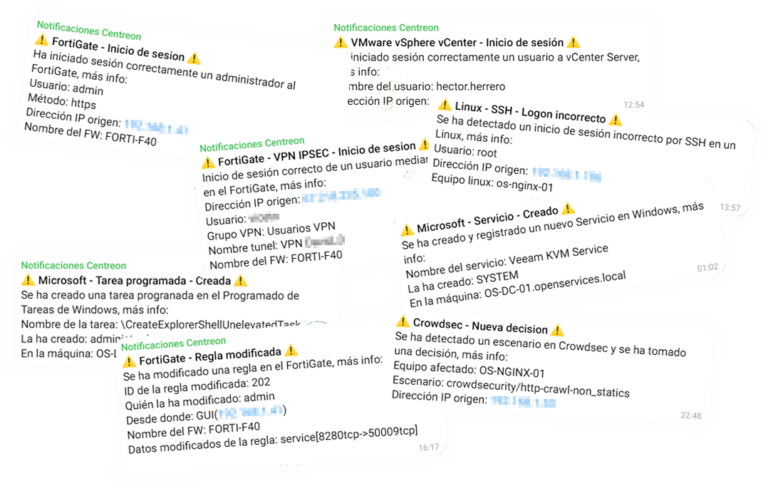
All of us who work with VMware infrastructures know that the entire foundation is supported by a fabulous hypervisor, our beloved ESXi hosts. A hypervisor based on security and stability, that they usually give few problems, but that it doesn't hurt to collect their logs in a centralized place to keep track of their health. As we know, We can store your logs in a syslog, So taking advantage of that, we will send the Logs to Logstash. Logstash will be in charge of receiving and ordering the logs, separating tedious text strings into different fields with valid data, to finally send this data to Elasticsearch and store it in an index. Then, through Kibana or Grafana, we will be able to visualize that content in a graphic way, and view login attempts to the host (by SSH, GUI…), Simply view accesses, Understand failed events, Compare different hypervisors with each other, Know repetitive errors… And all this as always in real time or to make historical data from the last 24 hours, week, month, year…

First we obviously have to have the Elastic Stack part installed, What has been Logstash, Elasticsearch and Kibana; then it would be to tell each hypervisor to send the Logs to Logstash, to the port of our choice. Stop that, We have many ways to do it, Host to Host, from GUI, CLI, from vCenter…
The most like if you have few hosts, from vCenter we go to each host, in “Configure” > Advanced System Settings” > and we seek “syslog.global”, we edit 'Syslog.global.logHost” Indicating in TCP/UDP format://DIRECCION_IP:PORT the destination of our Logs. Or better yet with PowerShell:
Get-VMHostSysLogServer -VMHost NOMBRE_HOST_ESXi Set-VMHostSysLogServer -VMHost NOMBRE_HOST_ESXi -SysLogServer 'udp://DIRECCION_IP:PORT Set-VMHostSysLogServer -VMHost NOMBRE_HOST_ESXi -SysLogServer 'tcp://DIRECCION_IP:PORT Get-VMHostSysLogServer -VMHost NOMBRE_HOST_ESXi Get-VMhostFireWallException -VMhost NOMBRE_HOST_ESXi -Name syslog Get-VMHostFireWallException -VMHost NOMBRE_HOST_ESXi -Name Syslog | Set-VMHostFirewallException -Enabled:$True.
Input {
        TCP {
                type => "ESXi"
                port => "1514"
                tags => ["VMware","ESXi"]
        }
}

filter {

        if [type] == "ESXi" {
                        Grok {
                            match => { "Message" => [
                               "<%{POSINT:syslog_pri}>%{TIMESTAMP_ISO8601:Date} %{HOSTNAME:Host_ESXi} Hostd: %{WORD:Log_nivel} %{PROG:Log_proceso}\[%{INT:Evento_id}\] \[Originator@6876 sub=%{GREEDYDATA:Title} opID=%{GREEDYDATA:Op_id} user=%{GREEDYDATA:User}\] %{GREEDYDATA:Evento_tipo} %{GREEDYDATA:Evento_codigo} : %{GREEDYDATA:Message}",
                               "<%{POSINT:syslog_pri}>%{TIMESTAMP_ISO8601:Date} %{HOSTNAME:Host_ESXi} Hostd: %{WORD:Log_nivel} %{PROG:Log_proceso}\[%{INT:Evento_id}\] \[Originator@6876 sub=%{GREEDYDATA:Title} opID=%{GREEDYDATA:Op_id} user=%{GREEDYDATA:User}\] %{GREEDYDATA:Evento_codigo}: %{GREEDYDATA:Message}",
                               "<%{POSINT:syslog_pri}>%{TIMESTAMP_ISO8601:Date} %{HOSTNAME:Host_ESXi} Hostd: %{WORD:Log_nivel} %{PROG:Log_proceso}\[%{INT:Evento_id}\] \[Originator@6876 sub=%{GREEDYDATA:Title} opID=%{GREEDYDATA:Op_id} user=%{GREEDYDATA:User}\] \(%{GREEDYDATA:Evento_codigo}\)",
                               "<%{POSINT:syslog_pri}>%{TIMESTAMP_ISO8601:Date} %{HOSTNAME:Host_ESXi} Hostd: %{WORD:Log_nivel} %{PROG:Log_proceso}\[%{INT:Evento_id}\] \[Originator@6876 sub=%{GREEDYDATA:Title} opID=%{GREEDYDATA:Op_id}\] \[%{GREEDYDATA:Evento_codigo}\]: %{GREEDYDATA:Message}",
                               "<%{POSINT:syslog_pri}>%{TIMESTAMP_ISO8601:Date} %{HOSTNAME:Host_ESXi} Hostd: %{WORD:Log_nivel} %{PROG:Log_proceso}\[%{INT:Evento_id}\] \[Originator@6876 sub=%{GREEDYDATA:Title} opID=%{GREEDYDATA:Op_id}\] %{GREEDYDATA:Message}",
                               "<%{POSINT:syslog_pri}>%{TIMESTAMP_ISO8601:Date} %{HOSTNAME:Host_ESXi} Hostd: %{WORD:Log_nivel} %{PROG:Log_proceso}\[%{INT:Evento_id}\] \[Originator@6876 sub=%{GREEDYDATA:Title}\] %{GREEDYDATA:Message}",
                               "<%{POSINT:syslog_pri}>%{TIMESTAMP_ISO8601:Date} %{HOSTNAME:Host_ESXi} Hostd: %{GREEDYDATA:Message}",
                               "<%{POSINT:syslog_pri}>%{TIMESTAMP_ISO8601:Date} %{HOSTNAME:Host_ESXi} Vpxa: %{WORD:Log_nivel} %{PROG:Log_proceso}\[%{INT:Evento_id}\] \[Originator@6876 sub=%{GREEDYDATA:Title} opID=%{GREEDYDATA:Op_id}\] %{GREEDYDATA:Message}",
                               "<%{POSINT:syslog_pri}>%{TIMESTAMP_ISO8601:Date} %{HOSTNAME:Host_ESXi} Vpxa: %{WORD:Log_nivel} %{PROG:Log_proceso}\[%{INT:Evento_id}\] \[Originator@6876 sub=%{GREEDYDATA:Title}\] %{GREEDYDATA:Message}",
                               "<%{POSINT:syslog_pri}>%{TIMESTAMP_ISO8601:Date} %{HOSTNAME:Host_ESXi} Vpxa: %{GREEDYDATA:Message}",
                               "<%{POSINT:syslog_pri}>%{TIMESTAMP_ISO8601:Date} %{HOSTNAME:Host_ESXi} Rhttpproxy: %{WORD:Log_nivel} %{PROG:Log_proceso}\[%{INT:Evento_id}\] \[Originator@6876 sub=%{GREEDYDATA:Title}\] %{GREEDYDATA:Message}",
                               "<%{POSINT:syslog_pri}>%{TIMESTAMP_ISO8601:Date} %{HOSTNAME:Host_ESXi} Rhttpproxy: %{GREEDYDATA:Message}",
                               "<%{POSINT:syslog_pri}>%{TIMESTAMP_ISO8601:Date} %{HOSTNAME:Host_ESXi} apiForwarder: %{WORD:Log_nivel} %{PROG:Log_proceso}\[%{INT:Evento_id}\] \[Originator@6876 sub=%{GREEDYDATA:Title}\] %{GREEDYDATA:Message}",
                               "<%{POSINT:syslog_pri}>%{TIMESTAMP_ISO8601:Date} %{HOSTNAME:Host_ESXi} VSANMGMTSVC: %{WORD:Log_nivel} %{PROG:Log_proceso}\[%{INT:Evento_id}\] \[opID=%{GREEDYDATA:Title}\] %{GREEDYDATA:Message}",
                               "<%{POSINT:syslog_pri}>%{TIMESTAMP_ISO8601:Date} %{HOSTNAME:Host_ESXi} VSANSYSTEM: %{WORD:Log_nivel} %{PROG:Log_proceso}\[%{INT:Evento_id}\] \[%{GREEDYDATA:Title}\] %{GREEDYDATA:Message}",
                               "<%{POSINT:syslog_pri}>%{TIMESTAMP_ISO8601:Date} %{HOSTNAME:Host_ESXi} VSANSYSTEM: %{GREEDYDATA:Message}",
                               "<%{POSINT:syslog_pri}>%{TIMESTAMP_ISO8601:Date} %{HOSTNAME:Host_ESXi} vmkernel: %{WORD:CPU_core}:%{INT:Evento_id}\)%{GREEDYDATA:Title}: %{GREEDYDATA:Message}",
                               "<%{POSINT:syslog_pri}>%{TIMESTAMP_ISO8601:Date} %{HOSTNAME:Host_ESXi} vmkernel: %{WORD:CPU_core}:%{INT:Evento_id} opID=%{PROG:Op_id}\)%{GREEDYDATA:Title}: %{GREEDYDATA:Message}",
                               "<%{POSINT:syslog_pri}>%{TIMESTAMP_ISO8601:Date} %{HOSTNAME:Host_ESXi} vmkernel: %{WORD:CPU_core}:%{INT:Evento_id}\)%{GREEDYDATA:Message}",
                               "<%{POSINT:syslog_pri}>%{TIMESTAMP_ISO8601:Date} %{HOSTNAME:Host_ESXi} vmkwarning: %{WORD:CPU_core}:%{INT:Evento_id}\)%{GREEDYDATA:Title}: %{GREEDYDATA:Message}",
                               "<%{POSINT:syslog_pri}>%{TIMESTAMP_ISO8601:Date} %{HOSTNAME:Host_ESXi} Fdm: %{WORD:Log_nivel} %{PROG:Log_proceso}\[%{INT:Evento_id}\] \[Originator@6876 sub=%{GREEDYDATA:Title} opID=%{PROG:Op_id}\] %{GREEDYDATA:Message}",
                               "<%{POSINT:syslog_pri}>%{TIMESTAMP_ISO8601:Date} %{HOSTNAME:Host_ESXi} Fdm: %{WORD:Log_nivel} %{PROG:Log_proceso}\[%{INT:Evento_id}\] \[Originator@6876 sub=%{GREEDYDATA:Title}\] %{GREEDYDATA:Message}",
                               "<%{POSINT:syslog_pri}>%{TIMESTAMP_ISO8601:Date} %{HOSTNAME:Host_ESXi} hostd-probe: %{WORD:Log_nivel} %{PROG:Log_proceso}\[%{INT:Evento_id}\] \[Originator@6876 sub=%{GREEDYDATA:Title}\] %{GREEDYDATA:Message}",
                               "<%{POSINT:syslog_pri}>%{TIMESTAMP_ISO8601:Date} %{HOSTNAME:Host_ESXi} %{PROG:Log_proceso}\[%{INT:Evento_id}\]: USER %{WORD:User} Pid %{INT:Pid} %{WORD:Tipo_proceso} %{GREEDYDATA:Message}",
                               "<%{POSINT:syslog_pri}>%{TIMESTAMP_ISO8601:Date} %{HOSTNAME:Host_ESXi} %{PROG:Log_proceso}\[%{INT:Evento_id}\]: %{GREEDYDATA:Message}",
                               "<%{POSINT:syslog_pri}>%{TIMESTAMP_ISO8601:Date} %{HOSTNAME:Host_ESXi} esxtokend: %{WORD:Log_nivel} %{PROG:Log_proceso}\[%{INT:Evento_id}\] \[Originator@6876 sub=%{GREEDYDATA:Title} opID=%{DATE:Op_id}\] %{GREEDYDATA:Message}",
                               "<%{POSINT:syslog_pri}>%{TIMESTAMP_ISO8601:Date} %{HOSTNAME:Host_ESXi} Kmxa: %{WORD:Log_nivel} %{PROG:Log_proceso}\[%{INT:Evento_id}\] \[Originator@6876 sub=%{GREEDYDATA:Title} opID=%{DATE:Op_id}\] %{GREEDYDATA:Message}",
                               "<%{POSINT:syslog_pri}>%{TIMESTAMP_ISO8601:Date} %{HOSTNAME:Host_ESXi} Kmxa: %{WORD:Log_nivel} %{PROG:Log_proceso}\[%{INT:Evento_id}\] \[Originator@6876 sub=%{GREEDYDATA:Title}\] %{GREEDYDATA:Message}",
                               "<%{POSINT:syslog_pri}>%{TIMESTAMP_ISO8601:Date} %{HOSTNAME:Host_ESXi} vobd:  \[%{WORD:Log_nivel}\] %{WORD:Log_id}: \[%{GREEDYDATA:Title}\] %{GREEDYDATA:Message}",
                               "<%{POSINT:syslog_pri}>%{TIMESTAMP_ISO8601:Date} %{HOSTNAME:Host_ESXi} configStoreBackup: %{GREEDYDATA:Message}",
                               "<%{POSINT:syslog_pri}>%{TIMESTAMP_ISO8601:Date} %{HOSTNAME:Host_ESXi} ConfigStore[%{INT:Evento_id}\]: %{GREEDYDATA:Message}",
                               "<%{POSINT:syslog_pri}>%{TIMESTAMP_ISO8601:Date} %{HOSTNAME:Host_ESXi} heartbeat: %{WORD:Uptime_estado} %{WORD:Uptime_tiempo}, %{GREEDYDATA:MVs_encendidas}; %{GREEDYDATA:Message}",
                               "<%{POSINT:syslog_pri}>%{TIMESTAMP_ISO8601:Date} %{HOSTNAME:Host_ESXi} ISCSID: %{GREEDYDATA:Message}",
                               "<%{POSINT:syslog_pri}>%{TIMESTAMP_ISO8601:Date} %{HOSTNAME:Host_ESXi} smart: \[%{WORD:Log_nivel}\] %{GREEDYDATA:Title}: %{GREEDYDATA:Message}",
                               "<%{POSINT:syslog_pri}>%{TIMESTAMP_ISO8601:Date} %{HOSTNAME:Host_ESXi} %{PROG:Log_proceso}\[%{INT:Evento_id}\]: %{GREEDYDATA:Message}"
                                       ]
                            }
                        }
        }
}


output {

        if ([type]=="ESXi"){

                ElasticSearch {
                   index => "vmware_esxi-%{+YYYY. MM.dd}"
                   hosts=> "DIRECCION_IP_ELASTICSEARCH:9200"
                }

        }
}
Now tap Logstash, so once connected to it, We create by a configuration file , For example: '/etc/logstash/conf.d/vmware-esxi.conf'. And that's where we'll indicate the listening port, If we choose TCP or UDP and also come the filters. Just as I always ask that the gurus not throw stones at me, but these groks are valid for parsing VMware ESXi Logs 7.0, yes indeed, Improvable and much 😉 Good, after separating the logs into chunks we will tell you that we are going to store it in Elasticsearch, and we put an index. Remember not to be like me and also add credentials, This is: username & password.

Once the configuration file has been created, remember to restart the Logstash service to reload the new configuration. After, we will go to Kibana and once the data is coming in we can go to "Management" > "Stack management" > "Kibana" > "Index Patterns" > "Create index pattern" to create the index pattern, As I said, as usual (in this case and without the quotation marks) 'vmware_esxi-*' and we'll have the data already stored in Elasticsearch correctly. We could now connect from "Discover" to our VMware ESXi index and visualize that it is collecting data, that all hosts send…

And to finish, after creating the index in Kibana, now in Grafana we should create a "Data Source" that points against our Elasticsearch and the newly created VMware ESXi index. Then it's letting your imagination run wild, make a Dashboard with different Dashboards, with different data to visualize, A style panel Sankey to view origin/destination IPs and traffic being sent, in column format, in stalemate to view specific data for example login attempts, Correct, Incorrect, Top up error logs and try to fix them, compare between different hosts the 'normal'’ of the frequency of certain info logs, warning, error….
As usual, all this to try to inspire you if you need, to take ideas and improve them, so with this you will be able to see what is happening on your ESXi's in real time, Putting an automatic refresh every 10 seconds is very impressive, It will also help us to analyze the summary of the last day, or knowing when something strange happens... As usual, Thank you all and to the fullest with which you move this type of content on social networks!!!