Skip to content

Blog Bujarra.com

Héctor Herrero's IT Blog

  • Blog
    • Citrix
    • Fortify
    • Home Assistant
    • Microsoft
    • Monitoring
    • Raspberry Pi
    • Several
    • VMware
  • A podcast for IT
  • Open Services IT
    • Services
    • Technologies
    • We
    • Contact
    • Citrix Book
    • Apps
  • Maas
  • News
    • Friend blogs
    • Safety
    • New versions
×

Tag: Grafana

A Podcast for IT – Put Grafana in your life

A Podcast for IT – Put Grafana in your life

I think it was about time to give you the fun with Grafana in a podcast for YOU, so for those of you who want to start or discover how Grafana can help you in your lives, Don't wait any longer!

  • 17 de October de 2022
Tagged How to get started, Dashboard, Data source, Grafana, Panel
Query REST APIs from Grafana

Query REST APIs from Grafana

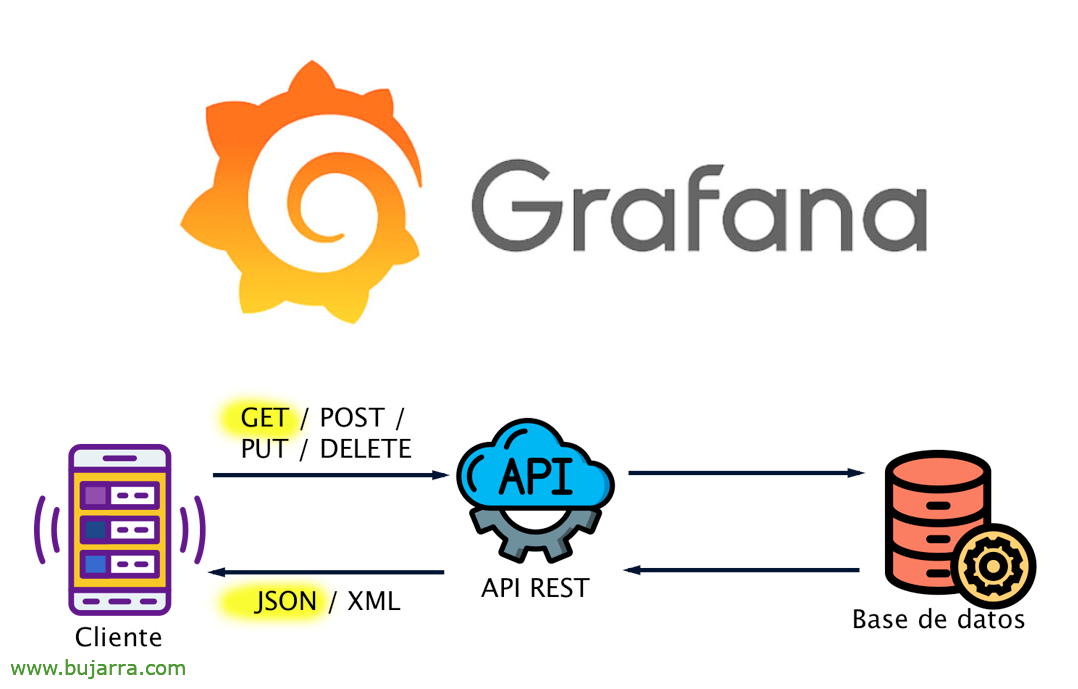
If we can consume the data we need via REST API (in JSON format), we will therefore be able to visualize ourselves in Grafana! The world is wonderful with Grafana! So, As we know, Today, almost any app allows us to perform queries through APIs, Don't wait any longer and squeeze them!

  • 11 de October de 2022
Tagged API, Consultation, Dashboard, Data source, Grafana
A podcast for IT – Monitoring with Centreon – Part II

A podcast for IT – Monitoring with Centreon – Part II

For monitoring lovers, For lovers of operational visibility, For lovers of having everything under control… Comes… Monitoring with Centreon – Part II in a podcast for YOU, where we will talk about visualizations and business!

  • 13 June de 2022
Tagged Alert, Centreon, Grafana, Free, Monitor
Enabling HTTPS in Grafana

Enabling HTTPS in Grafana

This post is aimed at encouraging you all to use safe services whenever we can, and Grafana by default is served through the 3000 but the traffic is HTTP, therefore, Not sure; and certain data such as credentials or queries may be better protected. So that's what this is about today!

  • 3 June de 2022
Tagged Assure, certificate, configure, Enable, Grafana
Enabling LDAP authentication in Grafana

Enabling LDAP authentication in Grafana

Well, Another post that will be short with the idea of using recommendations and best practices; Today it's time to remember that we shouldn't use local users, and so we get our hands on Grafana, and force logins from a central store such as our Active Directory or any LDAP.

  • 1 June de 2022
Tagged AD, Authentication, GIVES, Delegate, Active Directory
Collecting performance metrics in Elasticsearch and visualizing them in Grafana

Collecting performance metrics in Elasticsearch and visualizing them in Grafana

In this post we are going to try to see how to visualize any performance metric of a Windows Server computer or its services such as SQL Server, Exchange… with the intention of being able to visualize them in real time in Grafana.

  • 24 of May de 2022
Tagged Accountant, Performance counter, Elastic, Elastic Stack, Elasticsearch
Monitoring Fortigate with Telegraf, InfluxDB and Grafana

Monitoring Fortigate with Telegraf, InfluxDB and Grafana

In this post we are going to try to collect certain metrics from Fortigate, if we have this fabulous UTM firewall (or now called Next-Generation Firewall) we will be able to obtain this data through SNMP and visualize it in real time, thanks to Telegraf, InfluxDB and Grafana, It's a great thing!

  • 10 of May de 2022
Tagged CPU, Dashboard, Firewall, Flux, Fortify
File access auditing with Elasticsearch and Grafana

File access auditing with Elasticsearch and Grafana

This post is quite curious, since we can audit the accesses to the organization's files for free, collect those events in and store them in Elasticsearch, For what, then in a masterful way our Grafana allows us to easily visualize the accesses. And see who opened a document, modified or deleted it.

  • 27 de April de 2022
Tagged access, File, Records, Audit, Auditory
7 Screen″ for helpdesk and monitoring with Raspberry Pi

7 Screen″ for helpdesk and monitoring with Raspberry Pi

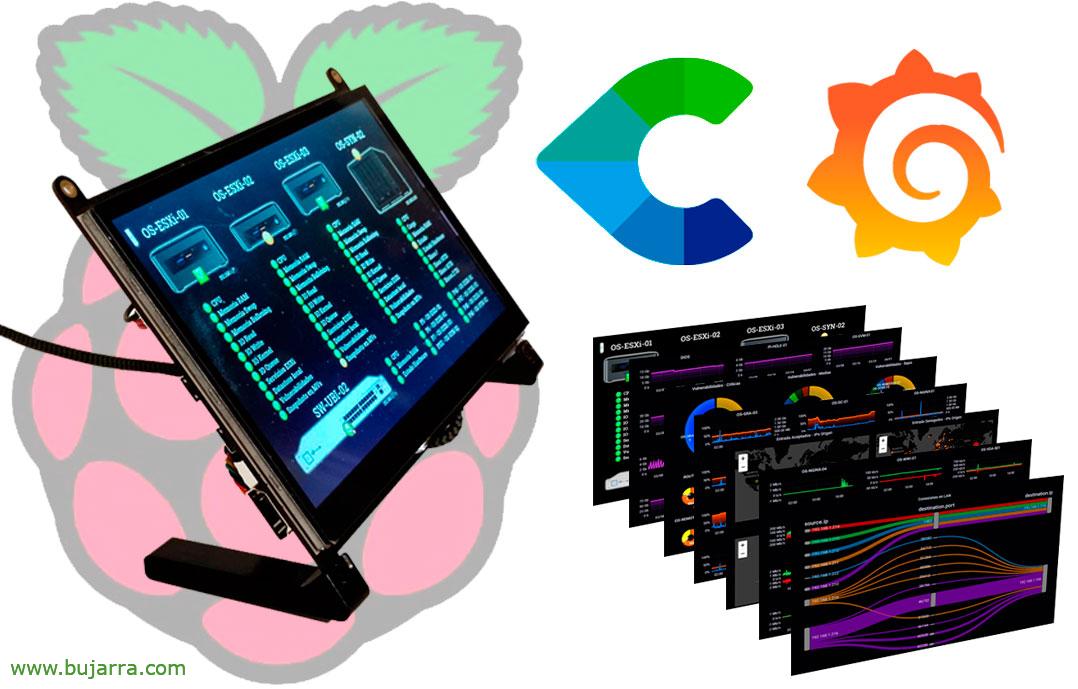
If you have a monitoring environment, This may still be your next step; And it's no more about having a tiny 7-inch screen″ at our desk, Something cute and geeky at the same time. Something that helps us to see in real time the state of our organization thanks to monitoring and operational visibility, 😎 I said .

  • 6 de April de 2022
Tagged 7, Alerts, Centreon, Elastic, Elasticsearch
A Podcast for IT – TIG for Dinosaurs

A Podcast for IT – TIG for Dinosaurs

The only good thing about Mondays, ¿What is it? ¡Effectively! There's a new podcast on “A Podcast for IT”, and this time we will talk about TIG, by Telegraf, of InfluxDB and Grafana… oh how beautiful, A talk on advanced real-time monitoring, Visualization and exploitation of metrics…

  • 7 of March of 2022
Tagged Grafana, Graphic, Influxdata, InfluxDB, Metric

Posts pagination

Previous 1 2 3 … 6 Next

 Edit Translation
Author: Héctor Herrero Hermida

Subscribe to news

Loading

Trending

  • Installing Bitwarden
  • FreePBX Installation and Basic Configuration
  • Implementing FSSOs to integrate Fortigate with Active Directory
  • RustDesk and RustDesk Web Client
  • Reading the home water meter with ESPHome and Home Assistant
  • Controlling IR devices from Home Assistant
  • Ollama, Getting started with local AI
  • Solar panels with Home Assistant and Huawei
  • Measuring rain with Home Assistant
  • Creating our Floorplan or Animated House Plan in Home Assistant

Most viewed

  • FreePBX Installation and Basic Configuration
  • Reading the home water meter with ESPHome and Home Assistant
  • Ollama, Getting started with local AI
  • Implementing FSSOs to integrate Fortigate with Active Directory
  • Creating our Floorplan or Animated House Plan in Home Assistant
  • Controlling IR devices from Home Assistant
  • Video surveillance system with Frigate and Home Assistant
  • RustDesk and RustDesk Web Client
  • Measuring rain with Home Assistant
  • Adding a timer in Home Assistant

Latest posts

  • Windows metrics with Prometheus and Grafana
  • CO2 sensor with ESPHome and Home Assistant
  • Rules and alerts with ElastAlert 2
  • Deploying NetBox and NetBox-Scanner
  • FortiGate metrics with Prometheus and Grafana
  • Ping metrics with Prometheus and Grafana
  • Deploying Prometheus & Grafana
  • VPN with Citrix NetScaler IV – AlwaysON
  • Monitoring Crowdsec with Centreon
  • VPN with Citrix NetScaler III – Authentication with certificates

Blog Bujarra.com


We monitor your infrastructure


We can set up a system that will monitor your entire infrastructure and you will know at all times how your business is doing!

​

  • You tell us what you have and we monitor it with a virtual machine in your environment for you.
  • Through several tools you will know the status of your servers and services, obtaining alerts in case of a problem.
  • You can have live maps, to see in real time what's going on and better understand it with network maps, of virtual environments, WAN connections between sites, mail traffic...
  • We can scale this infrastructure monitoring and know the SLA offered by your business or your departments, or suppliers...
  • As there are so many wonderful things, We recommend that you watch the following video where we have explained it in detail!


Do Tailor-made training

Windows Server – VMware vSphere – Citrix Virtual Apps & Desktops – Centreon

Deploy apps to any device (mobile, tablet, Corporate PC, Personal PC...) securely and from anywhere.

Centralizing Applications, We get the necessary control of our organization.

Cost savings, since it runs in the Datacenter and it will not be necessary to renew our fleet of equipment ever again!


  • Face-to-face or remote.
  • We use our own manuals with How To's and guides in detail.
  • 100% technicians with exercises and laboratories!
  • They are based on our experience, in our day-to-day lives.
  • Talk to us and we will give shape to your idea, We will train your technicians!
  • We don't keep secrets from anyone, Everything we can teach you will be a pleasure for us!


We are a consulting firm that cares and pampers

​​

  • We are a leading consulting firm in Information Technology at a national level.
  • We will listen to you, We will be able to talk and understand your needs and propose the best solution and at the best cost, Ask our customers!
  • They, Our dear customers use us as their pillow, and delighted!
  • We have a team fully specialized in IT consulting.
  • When designing any service or project, We will always look out for your satisfaction
  • Our Goal, Your trust!

With quality and added value

  • Analysis & Pre-Consulting
  • Cloud and Cloud Migrations
  • On-Premise Platform Migrations
  • Demos, Pre-production environments & laboratory
  • No service outages
  • We will train you and deliver excellent technical documentation.

​

​¡Let's work together!

  • We are a company that collaborates, with Open Mind, open to listening and working together!
  • We have a wide network of selected partners with whom we actively collaborate.
  • So that you can expand the range of services or training for your customers.


Technical support

  • We have that expertise you are looking for to give you a second level of support.
  • We will help you with day-to-day incidents that you cannot solve or take up a lot of time.
  • We have a CAU that can surely help you!
  • We work comfortably with time bags so that you can optimize your budgets.

Preventive control

  • We deploy a 'black box' in your environment that will monitor the status of your servers.
  • You will be able to access and know the status of your environment in real time with advanced metrics.
  • You will have personalized maps that will demonstrate how well controlled we have the environment. Ideal to put on a TV in your apartment!
  • We will be able to maintain your environment if you wish and take care of any incidents that may affect your business.
  • You will know at all times the SLA that your infrastructure is offering to your company.


Do Tailor-made training

Windows Server – VMware vSphere – Citrix Virtual Apps & Desktops – Centreon


  • Face-to-face or remote.
  • We use our own manuals with How To's and guides in detail.
  • 100% technicians with exercises and laboratories!
  • They are based on our experience, in our day-to-day lives.
  • Talk to us and we will give shape to your idea, We will train your technicians!
  • We don't keep secrets from anyone, Everything we can teach you will be a pleasure for us!


We perform the following services

  • Preventive audits on your IT infrastructure
  • We monitor and give you operational visibility.
  • Business Email Systems
  • Analysis and execution of contingency plans
  • Implementation and improvements of security systems
  • Server Virtualization
  • Application virtualization and Desks

Our differential

  • Closeness and honesty
  • Open source solutions and leading manufacturers
  • Migrations without impact
  • Second-level consulting and support
  • Mobile Device Management
  • Centralization of users
  • Our Principles: Security and best practices