Configuring an HP BladeSystem
In this document we see a server system that is already quite common in any more or less nice environment, I am not going to go into the issue of whether it is better for some environments or others, Not even if it's more comfortable, simple, Spend less… we will see an HP-based blade environment, this is an HP BladeSystem, no specific model and we will see all the configuration that we can make from its OA, or HP Onboard Administrator, which will be the management console for the entire chassis, of the 'irons', From this console we will be able to manage any component/element, as well as to see their status at all times.
Thus, by way of introduction, This is what a blade system would be like, which is a drawer where depending on the model we can put 8 Blades, 16… everything in itself would have redundancy and would be compact, since it does not take up the same amount 16 rack servers that 16 Blades. We have as many power supplies as we need that will power the chassis, not individually, but globally, as well as fans to keep the environment cool. We could configure by means of the sensors that depending on the temperature they work at more or less speed, as well as the power supplies and depending on our environment that we mount even the blades could be turned off if they are not needed (for example a VMware environment), With all this we can save a lot $$$ in electricity,Air conditioners, Physical Space/Racks,… How we can see each blade (server) Goes in a bay, Each server would carry its own operating system, Completely independent of the other blades (Or not), We have a small display to see the status of the entire chassis and to configure some parameters. On the back we have the switches, since this type of server avoids cabling, and Ethernet cabling are internal connections, as well as fiber, All switches are duplicated to prevent outages and have high redundancy. In addition to having one or two chassis management devices, which will be where we manage the system from, from the HP Onboard Administrator. Every HP BladeSystem is different, as well as between different manufacturers (an IBM BladeCenter x example), but they follow the same 'philosophy’ and they are 'practically’ Equal to configure.
The question is first of all to assemble the chassis (The irons) and then start configuring, For how to assemble the irons there each one read the official doc if you don't know 😉 since in this document we see the configuration to be made. After connecting the HP Onboard Administrator to the switch or us to it, we can connect to your default IP with the default username and password (Admin / password). With this it is clear that the first thing to change would be the IP we are interested in and the password of the admin user. Another way to do this would be from the Insight Display or the display that has the chassis on the front panel, From there we can make these kinds of basic changes.
In “Rack overview” We have a brief summary of our chassis, of the elements we have in it, a front and a rear view. The name of our enclosure will come, as well as serial number and part number.
In “Enclosure information” shows us the status of the components, if we have someone alert or everything is OK.
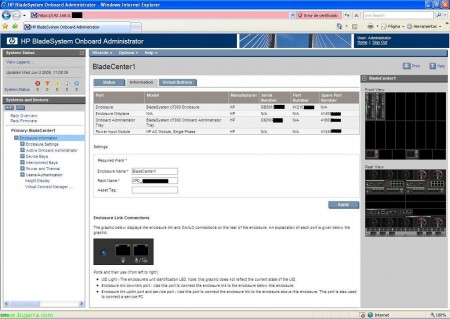
In “Enclosure information, eyelash “Information” we can change the name of our chassis/BladeSytem/enclosure, or the name of the DPC to which it belongs. In addition to showing us the serial numbers, it also indicates an aid for the connections of the chassis, About the UID LED for Identification, the connection port between the rest of our data center chassis (we must make the connection with the BladeSystem that follows below) called Enclosure link downlink port, and we also have the Enclosure link uplink port that will be to connect with the upper chassis or to connect a team if necessary.
In “Enclosure information”, eyelash “Virtual Buttons” we can turn the LED UID Light on or off, to tell any administrator on which unit they should perform their task.
In “Enclosure information” > “Enclosure Settings”. we have a summary of the BladeSystem devices so we can see if we are missing any to connect/enable and the firmware of all of them, we will have to take into account whenever possible to have the latest firmware and in all common elements to have the same firmware!
In “Enclosure information” > “Enclosure Settings” > “AlertMail” Well, that's it, As the name suggests, to activate email alerts from our chassis.
In “Enclosure information” > “Enclosure Settings” > “Device Power Sequence”, eyelash “Device Bays”, We can enable the power-on of the chassis blades with an order of priority.
In “Enclosure information” > “Enclosure Settings” > “Device Power Sequence”, eyelash “Interconnect Bays”, We can enable the power on of the chassis connection bays (Switches) in an order of priority.
In “Enclosure information” > “Enclosure Settings” > “Date and Time” To configure the Chassis Time Service, be it a manual schedule or a time server or NTP.
In “Enclosure information” > “Enclosure Settings” > “Enclosure TCP/IP Settings” is where we can configure the name, IP address, Netmask, gateway and DNS servers to chassis, to the Onboard Administrator.
In “Enclosure information” > “Enclosure Settings” > “Network Access” eyelash “Protocols”, are the connection protocols that we will enable to access the chassis. We have web access with HTTP or HTTPS, secure shell with SSH, Telnet and XML reply.
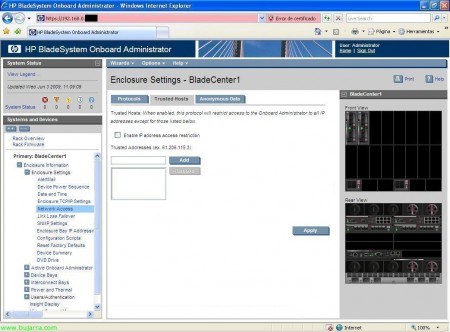
In “Enclosure information” > “Enclosure Settings” > “Network Access” eyelash “Trusted Hosts” if we enable it we will give access to the enclosure only from those IP addresses and not from the entire network.
In “Enclosure information” > “Enclosure Settings” > “Network Access” eyelash “Anonymous Data” Simply if we enable it it will give some information about the chassis before logging into it, it may be information that we are not interested in giving as a clue 😉
In “Enclosure information” > “Enclosure Settings” > “Link Loss Failover”, if we have two Onboard Administrator devices, and we want to make it so that when the primary OA loses connection, Switch to the other Onboard Administrator, We enable it and indicate the time of seconds that will pass without a network connection, the primary OA (as long as the secondary OA has a network!),
In “Enclosure information” > “Enclosure Settings” > “SNMP Settings” in case we have a monitoring system configured in our network, To manage alerts, Notices… Great Nagios, It was to put it 😉
In “Enclosure information” > “Enclosure Settings” > “Enclosure Bay IP Adresses”, on the “Device Bays”, we will have the IP addresses of the blades configured, not from your operating system, if not the iLO IP addresses to be able to connect later to each bay.
In “Enclosure information” > “Enclosure Settings” > “Enclosure Bay IP Adresses”, on the “Interconnect Bays”, we will have configured the IP addresses of the rear modules of the chassis, of fiber switches, Ethernet…
In “Enclosure information” > “Enclosure Settings” > “Configuration scripts”, We can import scripts with the configuration of the chassis to automate a configuration and make it faster, we can import it from a file or from a URL.
In “Enclosure information” > “Enclosure Settings” > “Reset Factory Defaults”, Well, that's why, to reset the chassis to the default settings that came from the factory,
In “Enclosure information” > “Enclosure Settings” > “Device Summary”, It is one of the most widely used displays for documenting a blade environment, is a summary of all the components we have in our chassis, with the description, Serial Number, Part number, maker, model, spare part number, Firmware version, Hardware version… Everything, From the blades, Switches, Power Supplies, Coolers/fans, Mezzanines of the blades, Chassis Info…
In “Enclosure information” > “Enclosure Settings” > “DVD Drive”, from here we can connect the CD/DVD drive of the chassis to a specific blade, in case we need to put a CD/DVD in a specific blade. Man, it is best done from the iLO connection… But tb is here 😛
In “Enclosure information” > “Active Onboard Administrator” on the “Status and Information”, We see how the state of the chassis says, gives us information about temperatures, and so on about our chassis.
In “Enclosure information” > “Active Onboard Administrator” on the “Virtual Buttons”, We have two buttons, one to reset the chassis completely, I hope this never has to be done, since there is no reason to restart the entire chassis, or to turn on the informative UID LED.
In “Enclosure information” > “Active Onboard Administrator” > “TCP/IP Settings”, it is merely informative, About our Onboard Administrator, Network Name Information, and other IP data,
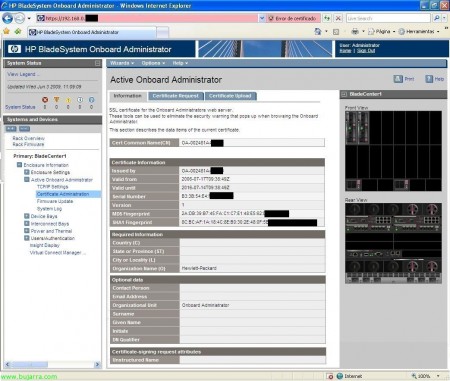
In “Enclosure information” > “Active Onboard Administrator” > “Certificate administration”, on the “Information” We have that, the certificate information for the SSL connection of the web server.
In “Enclosure information” > “Active Onboard Administrator” > “Certificate administration”, on the “Certificate Request”, it would serve to generate a certificate from us, using your own certificate or through CSR to be able to give it to a certificate issuing entity to generate a 'good' one. And on the “Certificate Upload” We would raise it.
In “Enclosure information” > “Active Onboard Administrator” > “Firmware Update”, We could update the firmware of our chassis, or if we are interested, We could downgrade it, we can upload it from a file on our computer, from a URL or directly from a USB flash drive connected to the chassis.
In “Enclosure information” > “Active Onboard Administrator” > “System Log”, on the “System Log” We've got everything that's going on in our chassis, A LOG.
In “Enclosure information” > “Active Onboard Administrator” > “System Log”, on the “Log Options” we can redirect the LOG's to a LOG's server, to a Kiwi type syslog.
In “Enclosure information” > “Device Bays” We have all our blades, With your state, whether the UID is on or not, Bay Number, On/off status, iLO IP address, and DVD drive status whether it is connected or not.
In “Enclosure information” > “Device Bays” > BLADE > eyelash “Status”, We have the information of our blade, If I had any alerts here I would tell us what the problem is, or if you have a high temperature. By the way, whenever we select a hardware element, It will indicate in the drawing on the right which device we are on, It helps when we have enough elements or on the subject of switches.
In “Enclosure information” > “Device Bays” > BLADE > eyelash “Information”, shows us information about the blade in question, All of it is quite interesting, or to write down, like MAC or WWPN…
In “Enclosure information” > “Device Bays” > BLADE > eyelash “Virtual Devices”, We have different options on the power button of our blade, as well as turning on the UID in it.
In “Enclosure information” > “Device Bays” > BLADE > eyelash “Boot Options”, We will select the boot order of the blade, or the next start,
In “Enclosure information” > “Device Bays” > BLADE > eyelash “IML Log”, o Integrated Management Log, We will have the blade logs, everything that happens to him will be recorded.
In “Enclosure information” > “Device Bays” > BLADE > “iLO” eyelash “Processor Information”, We can do remote management of the equipment, ideal for remote control of equipment, So we click on “Integrated Remote Console” to control the equipment and be able to manage their devices or if we have Java JRE then in “Remote Console”.
A control over the remote computer will open in a new window, to be able to do everything we need to do, Mounting Remote Units, connect local or remote CD/DVD, Restart, Off…
In “Enclosure information” > “Device Bays” > BLADE > “iLO” on the “Event Log”, we will have some leaked records at the iLO level of the team.
In “Enclosure information” > “Device Bays” > BLADE > “Port Mapping”, on the “Graphical View” We can see the internal connections of the blade, This screen is used to understand the internal connection between the blade and the switches that we have in our chassis, We can see the blade adapters (Embedded or integrated and mezzanines) each with its internal ports, they are usually additional network cards or HBA's (fiber) with one or more ports. And each port on each adapter shows which port on the fiber or ethernet switch it is connected to.
In “Enclosure information” > “Device Bays” > BLADE > “Port Mapping”, on the “Table View” We have the same information as in the previous tab but different view 😉
In “Enclosure information” > “Interconnect Bays” shows us the switches of the chassis, from the back, In my case two Ethernet swtiches and two fiber swtiches, shows us the state of them, as well as if you have the UID turned on, The type of switch and model, or your admin IP address.
In “Enclosure information” > “Interconnect Bays”on the “Status” We can see the status and diagnostics of the switch in question, if you have any alerts for electrical issues, temperature…
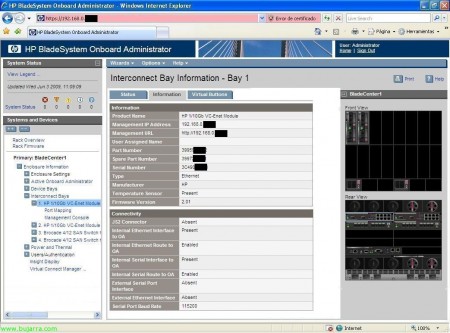
In “Enclosure information” > “Interconnect Bays” > Ethernet BAY > on the “Information” We see that, Information about this device, certain to note in a correct documentation or to process a breakdown in the future,
In “Enclosure information” > “Interconnect Bays” > Ethernet BAHIA , eyelash “Virtual Buttons” the same as before, is a virtual button to power off/restart the device or to turn on the UID if necessary,
In “Enclosure information” > “Interconnect Bays” > Ethernet BAHIA > “Port Mapping” We will be able to see the blades that we have connected to this Ethernet switch indicating which mezzanine of which blade is to which port of the switch, it also shows us the MAC in question of the device, and if it were a fiber switch it would show the WWNN.
In “Enclosure information” > “Interconnect Bays” > Ethernet BAHIA > “Management Console”, the switch management console would start, it would already be a configuration at the switch level, to be able to configure the zoning or whatever interests us, by means of “HP Virtual Connect Manager”,
In “Enclosure information” > “Interconnect Bays” > BAHIA Fiber > on the “Status”, We can see the status and diagnostics of the fiber switch in question, if you have any alerts for electrical issues, temperature…
In “Enclosure information” > “Interconnect Bays” > FIBER BAY > on the “Information” We see that, Information about this device, certain to note in a correct documentation or to process a breakdown in the future,
In “Enclosure information” > “Interconnect Bays” > BAHIA Fiber, eyelash “Virtual Buttons” is the virtual button to power off/restart the device or to turn on the UID if necessary,
In “Enclosure information” > “Interconnect Bays” > BAHIA Fiber > “Port Mapping” We will be able to see the blades that we have connected to this Ethernet switch indicating which mezzanine of which blade is to which port of the switch, it also shows us the WWNN of the connected HBA, Perfect for having everything well documented and annotated for path configuration issues.
In “Enclosure information” > “Interconnect Bays” > Ethernet BAHIA > “Management Console”, the fiber switch management console would start us, it would already be a configuration at the switch level, to be able to configure the zoning or whatever interests us, We have a tutorial here on how to set up an HTTP fiber switch://www.bujarra.com/?p=2752,
In “Enclosure information” > “Power and Thermal” We see the state of the chassis electrical issue, as well as its temperature and in case of any error it would mark us with error.
In “Enclosure information” > “Power and Thermal” > “Power Management” We can manage redundancy settings over chassis power supplies, as well as being able to enable “Dynamic Power” for cost savings by putting the F.A. that are not needed in a standby state so that they are not used if it is not necessary. Note, although it sounds like a tall tale this issue of saving with virtualization issues or putting this type of chassis, Savings are true, You just have to take out a calculator and multiply the servers you have by what they spend by what the kilowatt is worth per hour (Kwh) and you can be amazed at the costs involved in a single year! To all this you must add the expenses of air conditioning of course… If we want to invest, There's nothing better than virtualization with a blade environment.
In “Enclosure information” > “Power and Thermal” > “Enclosure Power Allocation” shows us the expense needed by the elements we currently have in the chassis, Our blades, Switches, Modules… and what our total capacity would be. We should always keep in mind that if a power supply breaks down, If we are still covered!
In “Enclosure information” > “Power and Thermal” > “Power Meter”, on the “Graphical View” shows us a graph of the consumption of our chassis,
In “Enclosure information” > “Power and Thermal” > “Power Meter”, on the “Tablel View” shows us some records about the consumption of our chassis,
In “Enclosure information” > “Power and Thermal” > “Power Subsystem” shows us the status of all our power supplies, as well as the power mode and whether we would have redundancy.
In “Enclosure information” > “Power and Thermal” > “Power Subsystem” > “Power Supply X” It will already show us specific information about a power supply in question such as its capacity/consumption, Serial Number, Part number, spare part number…
In “Enclosure information” > “Power and Thermal” > “Thermal Subsystem” on the “Fan Summary” It shows us a generic view of the fans or coolers that our chassis has as well as their use.
In “Enclosure information” > “Power and Thermal” > “Thermal Subsystem” on the “Fan Zones”, It shows us the ventilation zones of our chassis and whether or not they are covered by fans to cool the area, The normal thing is to place the fans behind the blades, since it doesn't make much sense to place them on the other side, anyway sometimes it is not us who assembles the chassis but an HP engineer, So it's not all our decisions 😉
In “Enclosure information” > “Power and Thermal” > “Thermal Subsystem” > “Fan X” It already shows us the individual status of each fan or cooler, as well as its use,
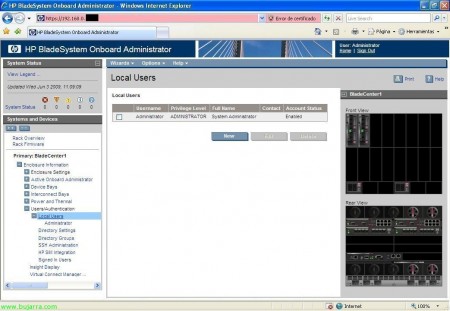
In “Enclosure information” > “Users / Authentication” > “Local Users” We will have management over local users of the chassis, To access Manage the Blade Environment.
In “Enclosure information” > “Users / Authentication” > “Local Users” > “Directory Settings”, to configure access instead of with local users with users of Directory services using the LDAP protocol,
In “Enclosure information” > “Users / Authentication” > “Local Users” > “Directory Groups” to manage LDAP user groups,
In “Enclosure information” > “Users / Authentication” > “Local Users” > “SSH Administration”, Manage keys for SSH,
In “Enclosure information” > “Users / Authentication” > “Local Users” > “HP SIM Integration” > to integrate the Onboard Administrator with HP Systems Insight Manager, for the badge pass.
In “Enclosure information” > “Users / Authentication” > “Local Users” > “Signed in Users” It shows us the users currently logged in to this blade chassis or a history of logins,
In “Enclosure information” > “Insight Display”, shows us the small screen on the front of the chassis, a small display that will allow us to make certain basic configurations with a couple of buttons, as well as see the condition of the chassis briefly.
And well, The interesting thing is that if we set up some of this it is well documented, both for us and to deliver to the customer and whoever comes after us knows what and how it is assembled, with logical drawings like this one on connections or documenting IP addresses, MAC's, WWNN, WWPN, wired… and we would have perfectly in this blade structure, much more comfortable to manage and maintain! A bargain!!!
