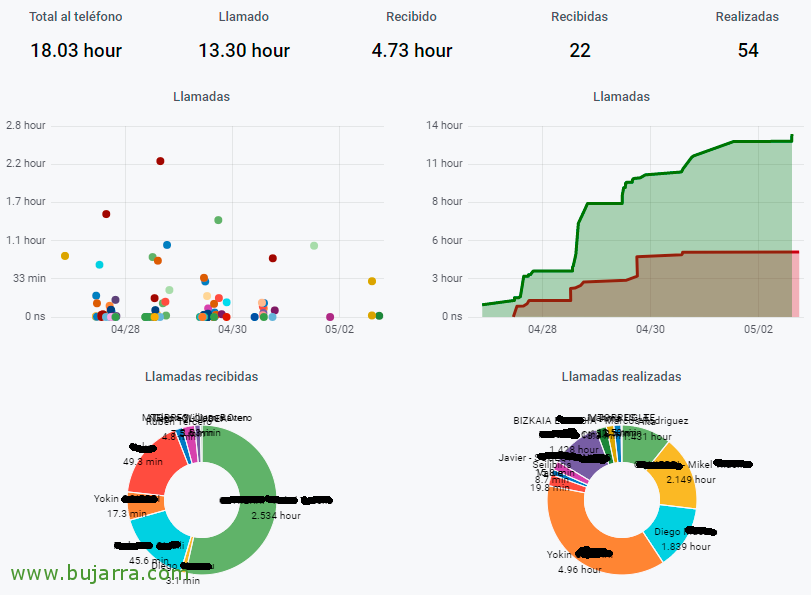
Visualizing what we talked about on the phone with Grafana

Well, in this post we will see something as always different and that we can simply add to our Grafana installation, and it is nothing more than exploiting the usage data of our phone calls. I've been using it for a long time and I wanted to share it in case you're interested, I was curious how much I talked on my mobile phone, with whom, what they called me and I called, See it by schedules, people… with nougat!

Visualizing IP addresses on a world map with Grafana

Well, This document is something particular, since it had a series of public IP addresses in a MySQL table, that I would like to visualize it in Grafana. Basically I'm talking about the visits to the blog 🙂 I have a WordPress and I don't have the database in my possession since it's on an external hosting… I leave you the steps I followed to achieve it, I hope it can be useful for other ideas.

Exploiting our Citrix farm with Grafana

Good, I leave you a post where we see how we can exploit the information stored by Citrix in its databases. As I imagine you know, Citrix stores in a database the records of what happens on our Citrix farm, but that is true, as much as you pay, as much as you get, that is, which depends on the Edition we have, Citrix will store information in those databases for 1 week, or 1 month or 1 year. Here we will see how to make our own panels with Grafana and without date limits!

Monitoring the status of our Xiaomi Mi Vacuum robot vacuum cleaner in Grafana

If we have the wonderful and all-powerful Xiaomi robot vacuum cleaner and you want to visualize its data in a Grafana dashboard, This is your post! In it we will see how to connect to the vacuum cleaner, how we can ask you questions and obtain all kinds of interesting data, and then store it in a MySQL database that we will attack with Grafana to visualize and process these metrics.

Monitoring our Bosch Indego lawnmower with Grafana

Come, We continue with a somewhat geeky post, but if you have a garden you may be interested… The thing is, I have one of those robots that mow the lawn at home, specifically a Bosch Indego 350, and through an API given to us by the manufacturer we will be able to know the status of the lawnmower at all times, as well as having access to some interesting values; And by the way, with this API we will also be able to control it, At the end of the post we will see how to check the weather and if it is not raining, Well, we sent it to be cut 😉

Collecting Windows metrics in Elasticsearch with Metricbeat and visualizing with Grafana

In this post, we'll look at another of Elasticsearch's wonderful components, within the Beats packages we will also find a utility that will help us to process and collect metrics from our Windows or Linux computers, known as Metricbeat. We will see how to export these metrics to Logstash to process them and store them in Elasticsearch to later visualize them with Kibana or Grafana!

Redirecting Event Viewer events from Windows computers to Elasticsearch with Winlogbeat and viewing with Grafana

GOOD, once we have already set up our platform with Elasticsearch, Logstash and Kibana, In this first post, we are going to analyze the events of the Event Viewer of our Windows computers using Winlogbeat! We'll install the small agent and send the events we decide to Logstash to process and store in Elasticsearch, and then we will visualize them with Grafana!