Nagios – Monitoring our Business Service (2/3)

Part 2! We're going to keep shaping this… Once you more or less have documented on paper or Excel (or however you prefer) this hierarchy of Services that we saw in Part 1 of our Business Service Monitoring, We will therefore proceed with the following, which will be the installation of the Plugin in Nagios, followed by its configuration already in Centreon to be able to use it!

Nagios – Monitoring Active Directory Status with NRPE

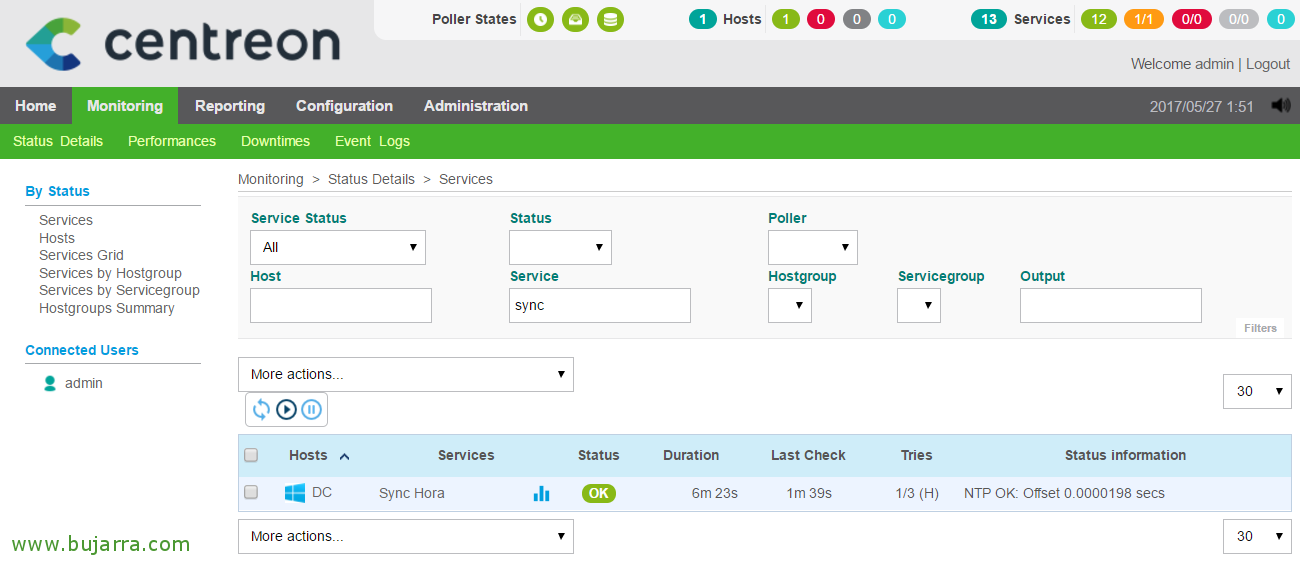
Another critical item that we will monitor will be the status of our respectable Active Directory, although we know that we will have him in cotton wool and we will pamper him, because Nagios or Centreon will also monitor it. Thanks to a script we will test your health on a scheduled basis, monitoring its status at all times, as well as that of the Domain Controllers, Therefore, another thing that we will get out of our heads and an automated system will do it for us, And if it fails… He warns us!

Nagios – Monitoring our Business Service (1/3)

Well, Well… I wanted to start with this type of posts and let's see how far we can go with our Nagios!! In a series of 3 documents we will see how to measure the SLA offered by different layers of our organization. We will not only use Nagios to monitor our Infrastructure Layer, we can scale by leveraging this foundation and monitor your Company's Operational Services, This is achieved by interrelating the infrastructure services already monitored with departmental needs, even monitoring the Business Service provided by your company.

Monitoring vulnerabilities with Nagios and OpenVAS

Well, Well! Another of the wonders that we can do with Nagios or Centreon is… the possibility of monitoring vulnerabilities in our computers! How great, truth?? We will rely on OpenVAS, We will use the checks we have to centralize them from a single console. We will be able to know how many vulnerabilities our servers put at risk and analyze their evolution with the graphs and of course receive alerts!

Using NagVis

Very good! If you feel like drawing and taking your monitoring to a new dimension, This is your document! With NagVis we can have fully customized real-time status maps! We will design maps that help us detect problems, to document our platform, Interconnectivity maps, both LAN and WAN… maps that we will make with Visio or PhotoShop and we will easily make them come to life!

Nagios – Checking the status of Users in Active Directory

When we have enough users in our organization, or above all, When they are a bit of moles, we can try and control your Active Directory accounts, to prevent and monitor possible failures, This is, We will be able to control whether user accounts are disabled, Your passwords have expired or are close to expiring, as well as if they have become blocked, among other options.

Nagstamon

One of the great utilities that we usually have installed to control our environment in real time is Nagstamon, This app installed at our kiosks, it will notify us when any monitoring item generates an alert. Integrates seamlessly into the Windows taskbar or anywhere in the workstation, also on computers with MacOS or Linux! We can use it to bypass email alerts if we are interested!

Nagios – Measuring Disk Load in Windows

If we are interested in controlling the load on the disks of our Windows servers, we will be able to monitor it simply thanks to a simple PowerShell that we will run through NRPE. We will obtain read and write latencies, Number of reads and writes per second, as well as the read and write ratio in MB/s and also the read queue time & writing!