Nagios – Monitoring active processes on Windows or Linux

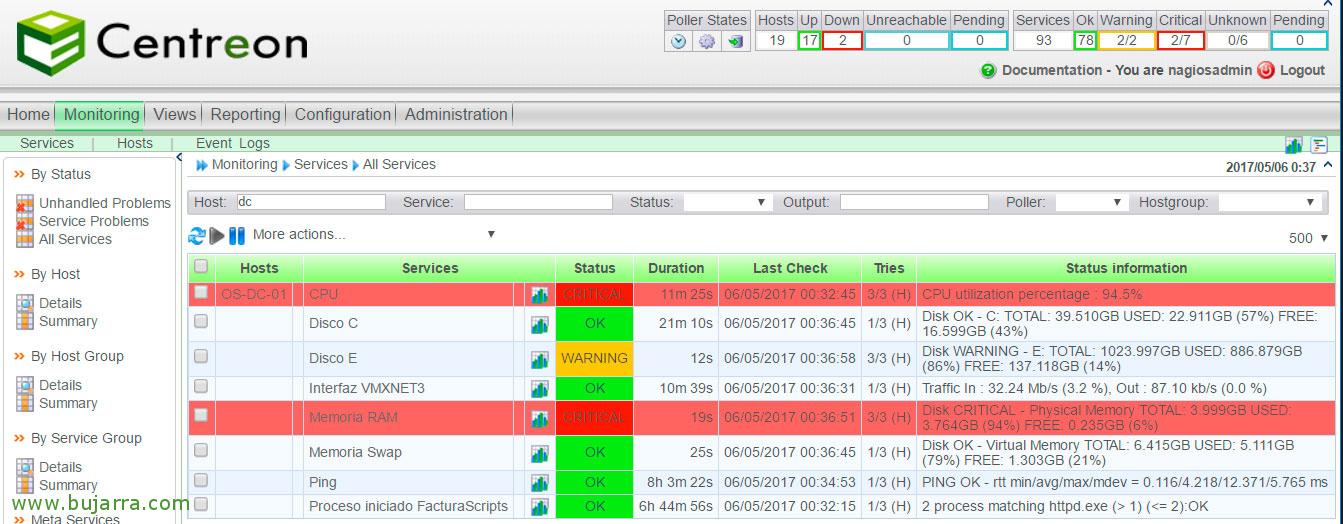
Very good! I leave you with a document that will be of help to us as long as we want to verify that we have a program running on any computer in our organization. We will see the necessary steps to be able to monitor if a remote computer, whether Windows or Linux, has any process running, and alert us in case of its fall. In addition, if we are interested, we could monitor its CPU or RAM consumption., all this only through SNMP!

Monitoring thanks to snmpwalk

Continuing with documents on Nagios or Centreon, Let's go with a post that may be in common use, above all, when we need to monitor something by SNMP and the Internet gurus have not developed a script that we need. We will see then, how to query over SNMP what a device might 'spit out'’ Thanks to SNMPWALK and then we will monitor it! And at the end of the document we'll look at how to monitor the traffic of any network device that has SNMP enabled as well!

Nagios – Monitoring our VMware vSphere VMs

In this document we will monitor interesting elements that we will obtain from our VMware vSphere-based virtual machines, centralizing in Nagios the checks we do to manage its values, Get alerts or generate graphs of your consumption. We will see, among other checks, in the VMs obtaining the values of their CPU Ready, CPU Wait, Memory Overhead, Memctl, Balloning, Write or read IOs…

Setting up corrective actions in Centreon

Another of the great advantages of having our monitored platform is that we can take advantage of and generate our own scripts to carry out corrective actions in our environment. Something that runs on the remote machine when we have a problem, for example if we run out of disk space, Well, a script that releases temporary, or the example that we will make in this document; when Nagios or Centreon detects that we have DNS Service from the DNS Server down, Well, let him start 🙂 it Ideal for any need we have, repetitive problems that we can automate their solution…

Nagios – Monitoring Citrix NetScaler

Continuing a little with Citrix elements that we can monitor… what less than our NetScaler! In this document, we'll see how to monitor a Citrix NetScaler VPX virtual appliance that is currently the Gateway for my Citrix XenDesktop organization. We will monitor its basic consumption such as CPU through SNMP, Memory or disks, but also the connections, your network interfaces or certificates!

Installing Graphite and Grafana to visualize Centreon's graphics

In this document we are going to hallucinate… especially if you are a fan of graph measurement and want to exploit them… we will be able to export the results of our Centreon to a machine with Grafana and obtain the best solution for the visualization of our data… The dashboards that we will be able to generate will be impressive, We will customize them to our liking, combining metrics or intervals of each item that we have monitored with Centreon. And super simple!

Nagios – Monitoring OTRS Queues

If in our environment we have OTRS as a management system and Nagios or Centreon as a monitoring system, we will be able to integrate them and do real wonders, In this first document we will see something very simple: How to monitor the queues we have in OTRS from Nagios or Centreon. And we will continue in the future with other types of integrations!

Nagios – Checking CAL licenses in Remote Desktop

Very good! This document can be used by all of us who have a Remote Desktop Licensing service in our organization, It will always be good to know how many licenses we consume to analyze future needs or receive alerts in case there are few free licenses left. Therefore, if you have a service of this type in your organization, why not monitor your organization's RDP CAL licenses to avoid problems?

Nagios – Monitoring our Business Service (3/3)

At last, Last document in this super interesting series! Where we can measure the SLA offered by our Business and the time it has been offering service, we will also see how to transfer this Business monitoring to interactive maps with NagVis; in addition to carrying out impact analysis on our Business, where we can analyze the critical points of our business!

Nagios – Monitoring the scope of our DHCP

What's up txabales!!! How do we usually find out that a DHCP server is down or a scope is full?? Thank you to our dear users, No? As the idea is that our users are the last to notice any problems in our organization (apart from the bosses)… we will take advantage of our monitoring facility based in Nagios or Centreon to control yet another critical point in an organization, DHCP Service!