Logon auditing of Active Directory users with Elasticsearch and Grafana

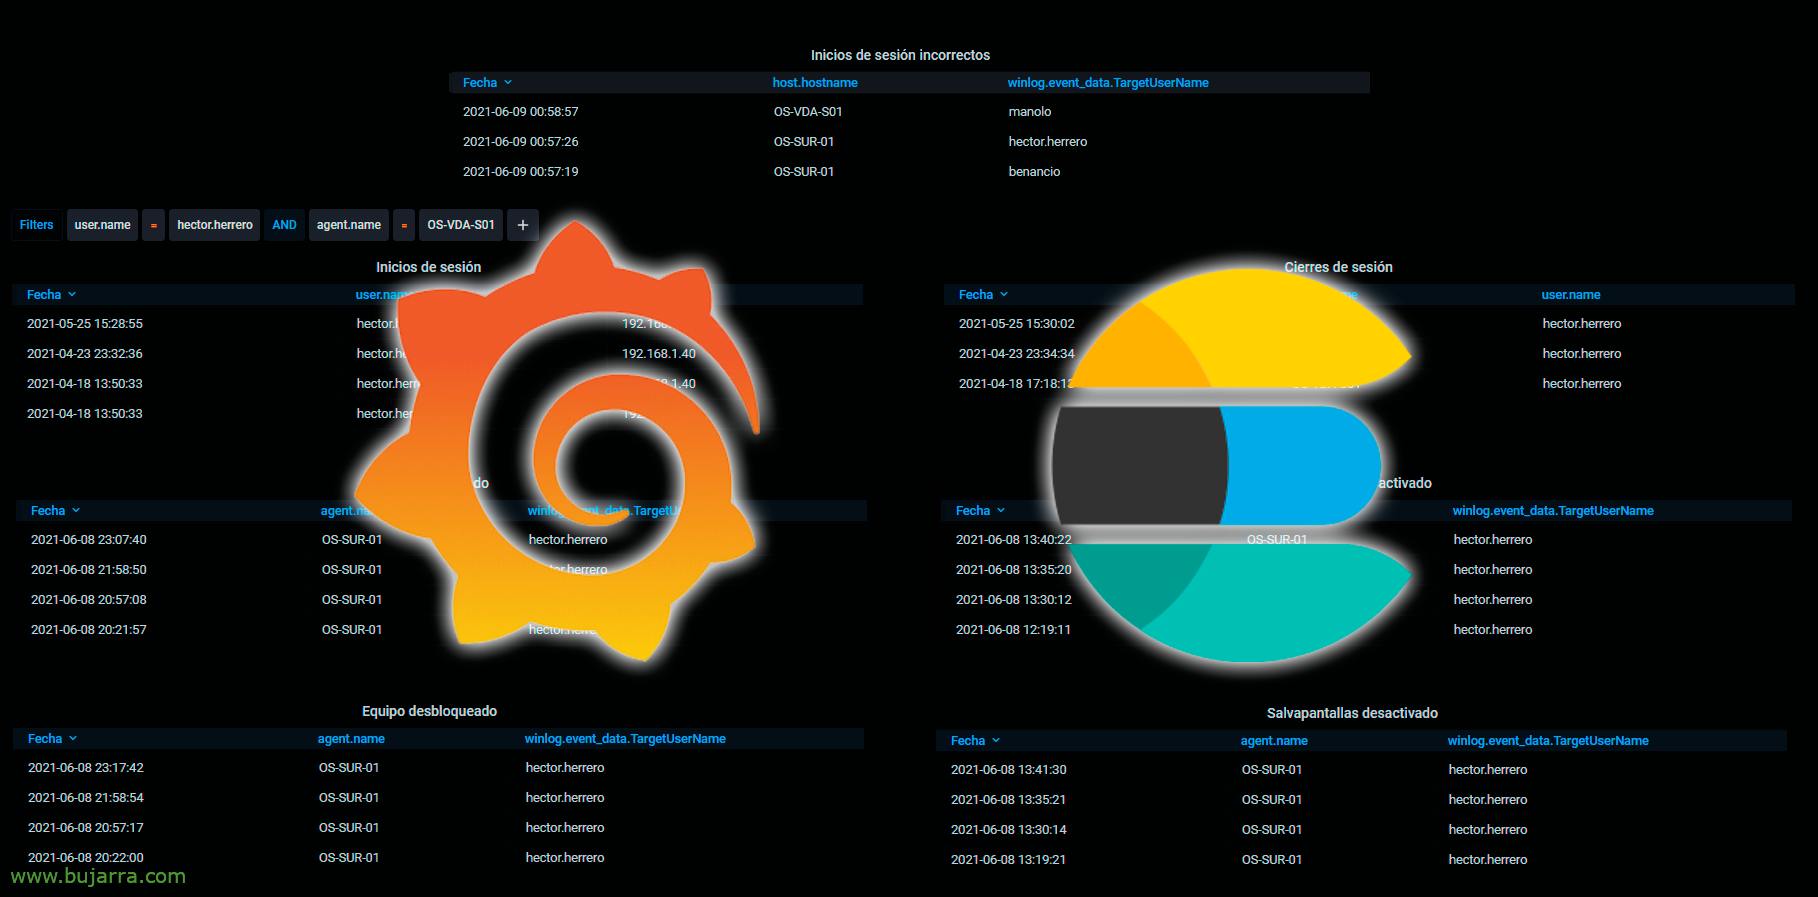
Something very common that we are usually asked for is the possibility of knowing the logons and other interesting information that a user can generate. In this post we will see how to visualize data as interesting as: When have they logged in, When they closed the session, Incorrect login attempts, When a computer has been locked, or unlocked, or when the screensaver has tripped, or it has been deactivated…

Collecting Windows metrics in Elasticsearch with Metricbeat and visualizing with Grafana

In this post, we'll look at another of Elasticsearch's wonderful components, within the Beats packages we will also find a utility that will help us to process and collect metrics from our Windows or Linux computers, known as Metricbeat. We will see how to export these metrics to Logstash to process them and store them in Elasticsearch to later visualize them with Kibana or Grafana!

Redirecting Event Viewer events from Windows computers to Elasticsearch with Winlogbeat and viewing with Grafana

GOOD, once we have already set up our platform with Elasticsearch, Logstash and Kibana, In this first post, we are going to analyze the events of the Event Viewer of our Windows computers using Winlogbeat! We'll install the small agent and send the events we decide to Logstash to process and store in Elasticsearch, and then we will visualize them with Grafana!