Measuring atmospheric pressure with Raspberry Pi

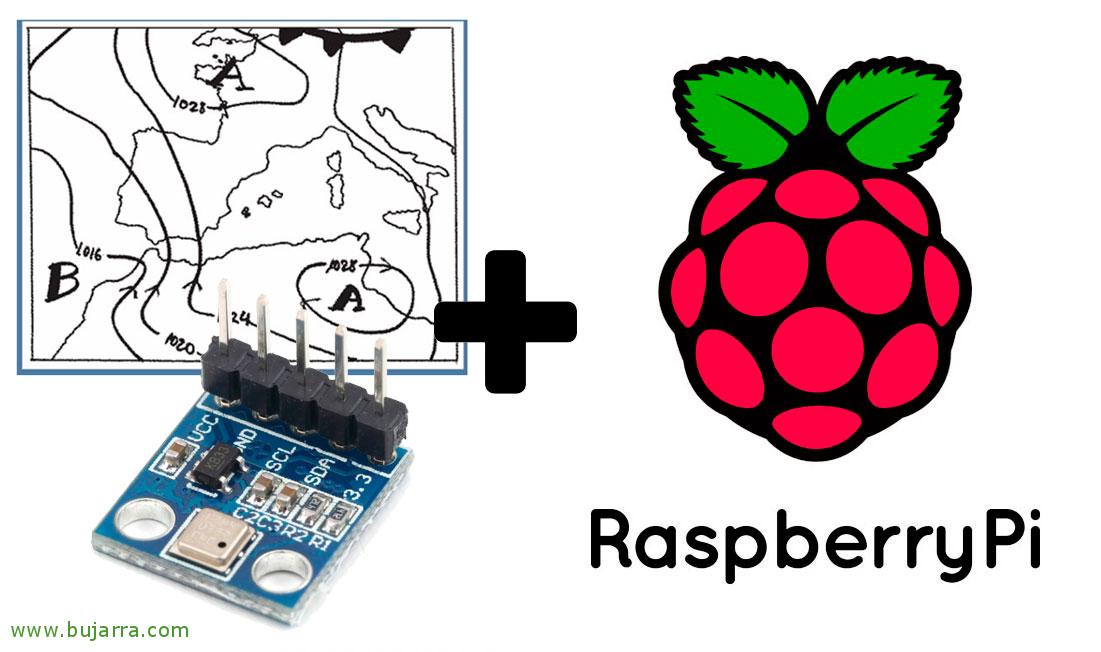
If we want to know and monitor atmospheric pressure in a cheap way… How could you not… This is your document! We can do it quickly with a Raspberry Pi and a sensor that barely goes beyond the 2 Euros! In this post we will see all the steps you will need to achieve it, Also as always… we will store the measurements in a MySQL database and then we will visualize the values with beautiful graphs thanks to Grafana!

Monitoring a Linux computer with Centreon, example with a Raspberry Pi + Temperature of your CPU

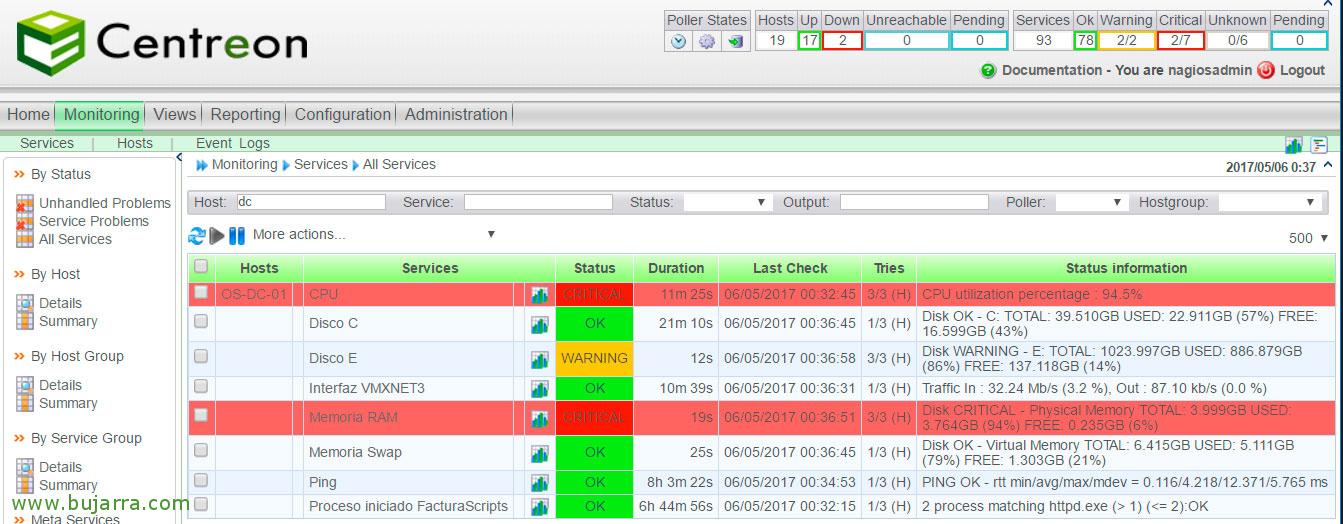
I'm going to put this post because of all the requests I've been receiving on how to monitor a Linux server. As obviously depends on the distribution, today we have an example with a Debian and more specifically we will see it on a Raspberry Pi that carries Raspbian. We'll monitor basic metrics like CPU, RAM, Swap Memory, Disks, Network Traffic, Uptime… And in the end we will see something very interesting!

Nagios – Monitoring Windows Counters

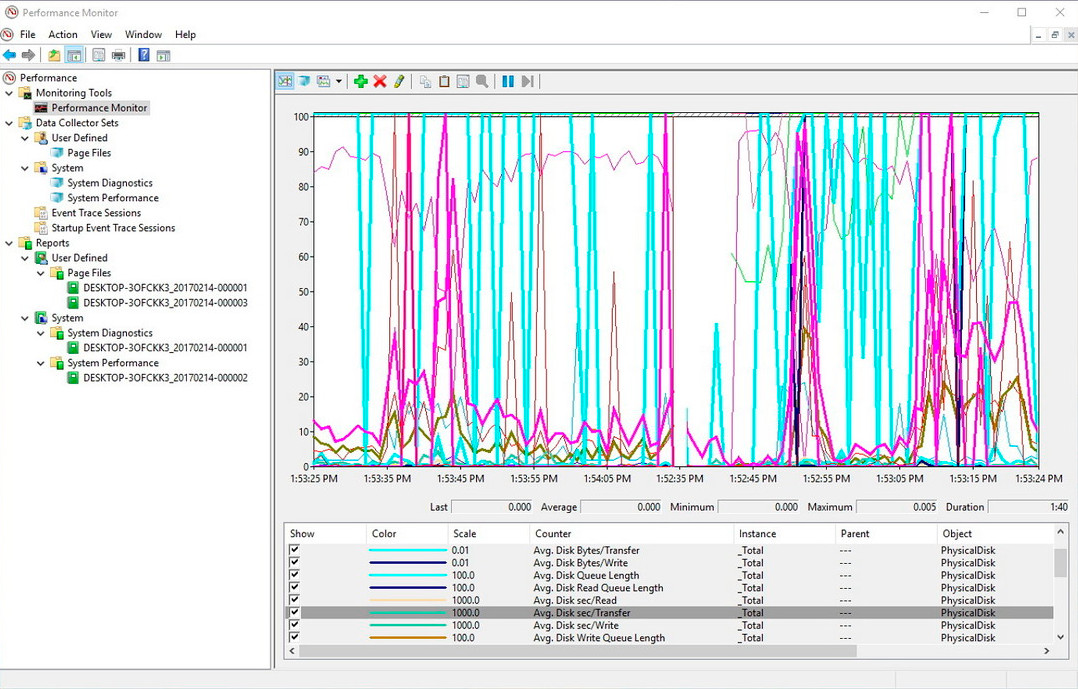
Something super useful is that thanks to Nagios, we will be able to monitor any performance counter of a Windows machine, Yes, any! We just need to know which one! We all know that the Performance Monitor of a Windows is super powerful and we have counters that allow us to analyze any parameter that we surely need. We can take this and centralize it to monitor from Nagios / Centreon.

Nagios – Monitoring active processes on Windows or Linux

Very good! I leave you with a document that will be of help to us as long as we want to verify that we have a program running on any computer in our organization. We will see the necessary steps to be able to monitor if a remote computer, whether Windows or Linux, has any process running, and alert us in case of its fall. In addition, if we are interested, we could monitor its CPU or RAM consumption., all this only through SNMP!

Measuring our electricity consumption with a Raspberry Pi

Continuing with documents of curious things we can do with a Raspberry Pi, Something very simple to achieve is for example to measure the electricity consumption of whatever we want, In this document we will see how to connect non-invasive current sensors to a Raspberry Pi and measure the cost of our home, since we will connect it to the electrical panel of our house! We will export the metrics to a MySQL database and then with Grafana we will create a dashboard where we can see in a very intuitive way what we spend on and how much!

Getting data from the Fitbit bracelet using Python and displaying graphs in Grafana

How is it going? Today we are going with a document that will surely be of interest to all those who have a Fitbit bracelet, with which you already know that we can obtain data about our lifestyle and such… Well, if you want to exploit this information and see it in beautiful graphics, This is your document! Using a Python script we will obtain the measurements that interest us and store them in a MySQL database, and then with Grafana paint the graphics that interest us!

Monitoring thanks to snmpwalk

Continuing with documents on Nagios or Centreon, Let's go with a post that may be in common use, above all, when we need to monitor something by SNMP and the Internet gurus have not developed a script that we need. We will see then, how to query over SNMP what a device might 'spit out'’ Thanks to SNMPWALK and then we will monitor it! And at the end of the document we'll look at how to monitor the traffic of any network device that has SNMP enabled as well!

Getting data from our Xiaomi Smart Scale with Raspberry Pi

If you have the Xiaomi Smart Scale scale, follow the steps in this document and you will be able to read your weight from a Raspberry Pi, by connecting via bluetooth we will store the records in a MySQL database, and so if we want we can exploit them super easily with Grafana! I will leave you with a series of documents that I think are very interesting to obtain information from different devices that control our life and visualize it in a super cool way!

Nagios – Monitoring our VMware vSphere VMs

In this document we will monitor interesting elements that we will obtain from our VMware vSphere-based virtual machines, centralizing in Nagios the checks we do to manage its values, Get alerts or generate graphs of your consumption. We will see, among other checks, in the VMs obtaining the values of their CPU Ready, CPU Wait, Memory Overhead, Memctl, Balloning, Write or read IOs…

Setting up corrective actions in Centreon

Another of the great advantages of having our monitored platform is that we can take advantage of and generate our own scripts to carry out corrective actions in our environment. Something that runs on the remote machine when we have a problem, for example if we run out of disk space, Well, a script that releases temporary, or the example that we will make in this document; when Nagios or Centreon detects that we have DNS Service from the DNS Server down, Well, let him start 🙂 it Ideal for any need we have, repetitive problems that we can automate their solution…